The Hartford 2011 Annual Report Download - page 71
Download and view the complete annual report
Please find page 71 of the 2011 The Hartford annual report below. You can navigate through the pages in the report by either clicking on the pages listed below, or by using the keyword search tool below to find specific information within the annual report.-
 1
1 -
2
-
3
-
4
-
5
-
6
-
7
-
8
-
9
-
10
-
11
-
12
-
13
-
14
-
15
-
16
-
17
-
18
-
19
-
20
-
21
-
22
-
23
-
24
-
25
-
26
-
27
-
28
-
29
-
30
-
31
-
32
-
33
-
34
-
35
-
36
-
37
-
38
-
39
-
40
-
41
-
42
-
43
-
44
-
45
-
46
-
47
-
48
-
49
-
50
-
51
-
52
-
53
-
54
-
55
-
56
-
57
-
58
-
59
-
60
-
 61
61 -
 62
62 -
 63
63 -
 64
64 -
 65
65 -
 66
66 -
 67
67 -
 68
68 -
 69
69 -
 70
70 -
 71
71 -
 72
72 -
 73
73 -
 74
74 -
 75
75 -
 76
76 -
 77
77 -
 78
78 -
 79
79 -
 80
80 -
 81
81 -
82
-
83
-
84
-
85
-
86
-
87
-
88
-
89
-
90
-
91
-
92
-
93
-
94
-
95
-
96
-
97
-
98
-
99
-
100
-
101
-
102
-
103
-
104
-
105
-
106
-
107
-
108
-
109
-
110
-
111
-
112
-
113
-
114
-
115
-
116
-
117
-
118
-
119
-
120
-
121
-
122
-
123
-
124
-
125
-
126
-
127
-
128
-
129
-
130
-
131
-
132
-
133
-
134
-
135
-
136
-
137
-
138
-
139
-
140
-
141
-
142
-
143
-
144
-
145
-
146
-
147
-
148
-
149
-
150
-
151
-
152
-
153
-
154
-
155
-
156
-
157
-
158
-
159
-
160
-
161
-
162
-
163
-
164
-
165
-
166
-
167
-
168
-
169
-
170
-
171
-
172
-
173
-
174
-
175
-
176
-
177
-
178
-
179
-
180
-
181
-
182
-
183
-
184
-
185
-
186
-
187
-
188
-
189
-
190
-
191
-
192
-
193
-
194
-
195
-
196
-
197
-
198
-
199
-
200
-
201
-
202
-
203
-
204
-
205
-
206
-
207
-
208
-
209
-
210
-
211
-
212
-
213
-
214
-
215
-
216
-
217
-
218
-
219
-
220
-
221
-
222
-
223
-
224
-
225
-
226
-
227
-
228
-
229
-
230
-
231
-
232
-
233
-
234
-
235
-
236
-
237
-
238
-
239
-
240
-
241
-
242
-
243
-
244
-
245
-
246
-
247
-
248
 |
 |

71
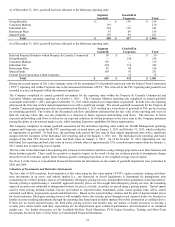
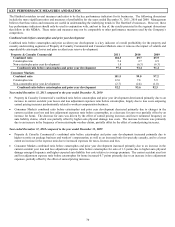
Return on Assets
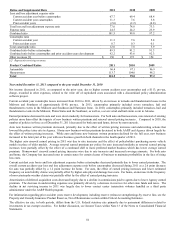
Return on assets is a key indicator of overall profitability for the Individual Annuity, Retirement Plans, Mutual Funds and Life Other
Operations reporting segments as a significant portion of their earnings is based on average assets under management.
[1] Proprietary mutual funds, Investment-Only mutual funds, Canadian mutual funds, and 529 college savings plans are reported in Mutual Funds in
2011 and 2010. Prior to 2010, proprietary mutual fund assets were included in Individual Annuity, Retirement Plans, and Mutual Funds, as those
same assets generate earnings for each of these segments.
Year ended December 31, 2011 compared to year ended December 31, 2010
• Individual Annuity’ s ROA, core earnings excluding Unlock, increased in 2011 primarily due to the favorable impact of a flat DAC
amortization rate on 2011 earnings and a DRD tax settlement benefit in 2011.
• Retirement Plans’ ROA, core earnings excluding Unlock, increased in 2011 primarily due to increased fee and investment income
resulting from higher average general account invested assets and favorable partnership income as well as a DRD tax settlement
benefit.
• Mutual Funds’ ROA, core earnings excluding Unlock, increased in 2011 primarily due to higher earnings from continuing
operations resulting primarily from lower operating expenses in 2011. Assets under management and asset-based fee income were
unfavorably impacted by declining equity market performance and increasing outflows over the course of 2011.
• Life Other Operations’ ROA, core earnings excluding Unlock, increased in 2011 primarily due to a lower DAC amortization rate, as
earnings increased in 2011 compared to 2010, and a DRD tax settlement benefit, offset in part by decreased investment income due
to lower average account values in 2011 as compared to 2010.
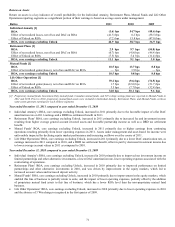
Year ended December 31, 2010 compared to year ended December 31, 2009
• Individual Annuity’ s ROA, core earnings excluding Unlock, increased in 2010 primarily due to improved net investment income on
limited partnerships and other alternative investments, a lower DAC amortization rate, lower operating expenses associated with the
restructuring of operations.
• Retirement Plans’ ROA, core earnings excluding Unlock, increased in 2010 primarily due to improved performance on limited
partnerships and other alternative investments in 2010, and was driven by improvement in the equity markets, which led to
increased account values and increased deposit activity.
• Mutual Funds’ ROA, core earnings excluding Unlock, increased in 2010 primarily due to improvement in the equity markets, which
enabled this line of business to partially return to scale, and the impact of lower operating expenses, partially offset by the addition
of proprietary mutual fund assets to this line of business, which has a lower ROA level than the non-proprietary mutual fund
business.
• Life Other Operations’ ROA, core earnings excluding Unlock, increased in 2010 primarily due to lower operating expenses in 2010
and the absence of 3 Win charges recognized in the first quarter of 2009.
Ratios
2011
2010
2009
Individual Annuity [1]
ROA
(1.6) bps
54.7 bps
(48.6) bps
Effect of net realized losses, net of tax and DAC on ROA
(41.3) bps
0.2 bps
(38.5) bps
Effect of Unlock on ROA
(7.2) bps
15.8 bps
(47.0) bps
ROA, core earnings excluding Unlock
46.9 bps
38.7 bps
36.9 bps
Retirement Plans [1]
ROA
2.9 bps
9.7 bps
(54.8) bps
Effect of net realized losses, net of tax and DAC on ROA
(0.7) bps
(4.8) bps
(46.4) bps
Effect of Unlock on ROA
(7.5) bps
5.4 bps
(11.4) bps
ROA, core earnings excluding Unlock
11.1 bps
9.1 bps
3.0 bps
Mutual Funds [1]
ROA
10.5 bps
13.7 bps
8.8 bps
Effect of net realized gains/(losses), net of tax and DAC on ROA
— bps
3.9 bps
— bps
ROA, core earnings excluding Unlock
10.5 bps
9.8 bps
8.8 bps
Life Other Operations [1]
ROA
39.2 bps
(9.6) bps
(74.5) bps
Effect of net realized gains/(losses), net of tax and DAC on ROA
1.7 bps
(32.0) bps
(51.7) bps
Effect of Unlock on ROA
3.5 bps
(7.7) bps
(32.4) bps
ROA, core earnings excluding Unlock
34.0 bps
30.1 bps
9.6 bps