The Hartford 2011 Annual Report Download - page 203
Download and view the complete annual report
Please find page 203 of the 2011 The Hartford annual report below. You can navigate through the pages in the report by either clicking on the pages listed below, or by using the keyword search tool below to find specific information within the annual report.-
 1
1 -
2
-
3
-
4
-
5
-
6
-
7
-
8
-
9
-
10
-
11
-
12
-
13
-
14
-
15
-
16
-
17
-
18
-
19
-
20
-
21
-
22
-
23
-
24
-
25
-
26
-
27
-
28
-
29
-
30
-
31
-
32
-
33
-
34
-
35
-
36
-
37
-
38
-
39
-
40
-
41
-
42
-
43
-
44
-
45
-
46
-
47
-
48
-
49
-
50
-
51
-
52
-
53
-
54
-
55
-
56
-
57
-
58
-
59
-
60
-
61
-
62
-
63
-
64
-
65
-
66
-
67
-
68
-
69
-
70
-
71
-
72
-
73
-
74
-
75
-
76
-
77
-
78
-
79
-
80
-
81
-
82
-
83
-
84
-
85
-
86
-
87
-
88
-
89
-
90
-
91
-
92
-
93
-
94
-
95
-
96
-
97
-
98
-
99
-
100
-
101
-
102
-
103
-
104
-
105
-
106
-
107
-
108
-
109
-
110
-
111
-
112
-
113
-
114
-
115
-
116
-
117
-
118
-
119
-
120
-
121
-
122
-
123
-
124
-
125
-
126
-
127
-
128
-
129
-
130
-
131
-
132
-
133
-
134
-
135
-
136
-
137
-
138
-
139
-
140
-
141
-
142
-
143
-
144
-
145
-
146
-
147
-
148
-
149
-
150
-
151
-
152
-
153
-
154
-
155
-
156
-
157
-
158
-
159
-
160
-
161
-
162
-
163
-
164
-
165
-
166
-
167
-
168
-
169
-
170
-
171
-
172
-
173
-
174
-
175
-
176
-
177
-
178
-
179
-
180
-
181
-
182
-
183
-
184
-
185
-
186
-
187
-
188
-
189
-
190
-
191
-
192
-
 193
193 -
 194
194 -
 195
195 -
 196
196 -
 197
197 -
 198
198 -
 199
199 -
 200
200 -
 201
201 -
 202
202 -
 203
203 -
 204
204 -
 205
205 -
 206
206 -
 207
207 -
 208
208 -
 209
209 -
 210
210 -
 211
211 -
 212
212 -
 213
213 -
214
-
215
-
216
-
217
-
218
-
219
-
220
-
221
-
222
-
223
-
224
-
225
-
226
-
227
-
228
-
229
-
230
-
231
-
232
-
233
-
234
-
235
-
236
-
237
-
238
-
239
-
240
-
241
-
242
-
243
-
244
-
245
-
246
-
247
-
248
 |
 |

THE HARTFORD FINANCIAL SERVICES GROUP, INC.
NOTES TO CONSOLIDATED FINANCIAL STATEMENTS (continued)
F-68
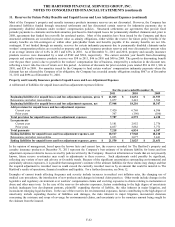
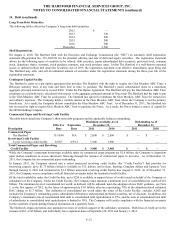
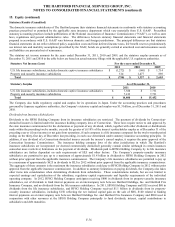
13. Income Tax
The Company recognizes taxes payable or refundable for the current year and deferred taxes for the tax consequences of differences
between the financial reporting and tax basis of assets and liabilities. Deferred tax assets and liabilities are measured using enacted tax
rates expected to apply to taxable income in the years the temporary differences are expected to reverse.
Income (loss) from continuing operations before income taxes included income (loss) from domestic operations of $466, $2,133 and
$(1,365) for 2011, 2010 and 2009, and income (loss) from foreign operations of $(236), $224 and $(356) for 2011, 2010 and 2009.
Substantially all of the income (loss) from foreign operations is earned by a Japanese subsidiary.
The provision (benefit) for income taxes consists of the following:
For the years ended December 31,
2011
2010
2009
Income Tax Expense (Benefit)
Current - U.S. Federal
$
(495)
$
106
$
509
- International
22
69
––
Total current
(473)
175
509
Deferred - U.S. Federal Excluding NOL Carryforward
900
133
(1,584)
- Net Operating Loss Carryforward
(652)
1
712
- International
(121)
303
(475)
Total deferred
127
437
(1,347)
Total income tax expense (benefit)
$
(346)
$
612
$
(838)
Deferred tax assets (liabilities) include the following as of December 31:
Deferred Tax Assets
2011
2010
Tax discount on loss reserves
$
632
$
647
Tax basis deferred policy acquisition costs
528
579
Unearned premium reserve and other underwriting related reserves
421
401
Investment-related items
1,159
1,454
Insurance product derivatives
913
1,792
Employee benefits
523
555
Net unrealized losses on investments
––
4
Minimum tax credit
868
1,183
Net operating loss carryover
747
88
Other
149
63
Total Deferred Tax Assets
5,940
6,766
Valuation Allowance
(95)
(173)
Deferred Tax Assets, Net of Valuation Allowance
5,845
6,593
Deferred Tax Liabilities
Financial statement deferred policy acquisition costs and reserves
(3,094)
(2,721)
Net unrealized gains on investments
(1,210)
––
Other depreciable & amortizable assets
(104)
(42)
Other
(39)
(105)
Total Deferred Tax Liabilities
(4,447)
(2,868)
Net Deferred Tax Asset
$
1,398
$
3,725
As of December 31, 2011 and 2010, the net deferred tax asset included the expected tax benefit attributable to net operating losses of
$2,239 and $327, respectively, consisting of U.S. losses of $1,880 and $17, respectively, and foreign losses of $359 and $310. The U.S.
losses expire from 2013-2031 and the foreign losses have no expiration.