The Hartford 2011 Annual Report Download - page 194
Download and view the complete annual report
Please find page 194 of the 2011 The Hartford annual report below. You can navigate through the pages in the report by either clicking on the pages listed below, or by using the keyword search tool below to find specific information within the annual report.-
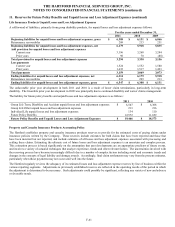
 1
1 -
2
-
3
-
4
-
5
-
6
-
7
-
8
-
9
-
10
-
11
-
12
-
13
-
14
-
15
-
16
-
17
-
18
-
19
-
20
-
21
-
22
-
23
-
24
-
25
-
26
-
27
-
28
-
29
-
30
-
31
-
32
-
33
-
34
-
35
-
36
-
37
-
38
-
39
-
40
-
41
-
42
-
43
-
44
-
45
-
46
-
47
-
48
-
49
-
50
-
51
-
52
-
53
-
54
-
55
-
56
-
57
-
58
-
59
-
60
-
61
-
62
-
63
-
64
-
65
-
66
-
67
-
68
-
69
-
70
-
71
-
72
-
73
-
74
-
75
-
76
-
77
-
78
-
79
-
80
-
81
-
82
-
83
-
84
-
85
-
86
-
87
-
88
-
89
-
90
-
91
-
92
-
93
-
94
-
95
-
96
-
97
-
98
-
99
-
100
-
101
-
102
-
103
-
104
-
105
-
106
-
107
-
108
-
109
-
110
-
111
-
112
-
113
-
114
-
115
-
116
-
117
-
118
-
119
-
120
-
121
-
122
-
123
-
124
-
125
-
126
-
127
-
128
-
129
-
130
-
131
-
132
-
133
-
134
-
135
-
136
-
137
-
138
-
139
-
140
-
141
-
142
-
143
-
144
-
145
-
146
-
147
-
148
-
149
-
150
-
151
-
152
-
153
-
154
-
155
-
156
-
157
-
158
-
159
-
160
-
161
-
162
-
163
-
164
-
165
-
166
-
167
-
168
-
169
-
170
-
171
-
172
-
173
-
174
-
175
-
176
-
177
-
178
-
179
-
180
-
181
-
182
-
183
-
 184
184 -
 185
185 -
 186
186 -
 187
187 -
 188
188 -
 189
189 -
 190
190 -
 191
191 -
 192
192 -
 193
193 -
 194
194 -
 195
195 -
 196
196 -
 197
197 -
 198
198 -
 199
199 -
 200
200 -
 201
201 -
 202
202 -
 203
203 -
 204
204 -
205
-
206
-
207
-
208
-
209
-
210
-
211
-
212
-
213
-
214
-
215
-
216
-
217
-
218
-
219
-
220
-
221
-
222
-
223
-
224
-
225
-
226
-
227
-
228
-
229
-
230
-
231
-
232
-
233
-
234
-
235
-
236
-
237
-
238
-
239
-
240
-
241
-
242
-
243
-
244
-
245
-
246
-
247
-
248
 |
 |

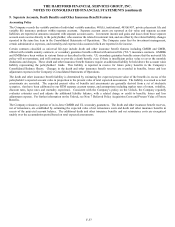
THE HARTFORD FINANCIAL SERVICES GROUP, INC.
NOTES TO CONSOLIDATED FINANCIAL STATEMENTS (continued)
F-59
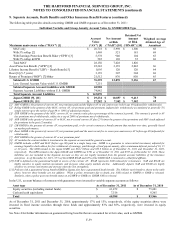
9. Separate Accounts, Death Benefits and Other Insurance Benefit Features (continued)
The following table provides details concerning GMDB and GMIB exposure as of December 31, 2011:
Individual Variable and Group Annuity Account Value by GMDB/GMIB Type
Maximum anniversary value ("MAV") [1]
Account
Value
(“AV”) [8]
Net Amount
at Risk
(“NAR”) [10]
Retained Net
Amount
at Risk
(“RNAR”) [10]
Weighted Average
Attained Age of
Annuitant
MAV only
$
20,718
$
5,998
$
1,500
68
With 5% rollup [2]
1,469
521
181
68
With Earnings Protection Benefit Rider (“EPB”) [3]
5,378
940
104
65
With 5% rollup & EPB
585
169
35
68
Total MAV
28,150
7,628
1,820
Asset Protection Benefit ("APB") [4]
22,343
3,139
2,042
66
Lifetime Income Benefit ("LIB") – Death Benefit [5]
1,095
120
120
64
Reset [6] (5-7 years)
3,139
307
304
68
Return of Premium (“ROP”) [7]/Other
21,512
876
850
65
Subtotal U.S. GMDB
76,239
12,070
5,136
67
Less: General Account Value with U.S. GMDB
7,251
Subtotal Separate Account Liabilities with GMDB
68,988
Separate Account Liabilities without U.S. GMDB
74,882
Total Separate Account Liabilities
$
143,870
Japan GMDB [9], [11]
$
29,234
$
10,857
$
9,413
70
Japan GMIB [9], [11]
$
27,282
$
7,502
$
7,502
69
[1] MAV GMDB is the greatest of current AV, net premiums paid and the highest AV on any anniversary before age 80 (adjusted for withdrawals).
[2] Rollup GMDB is the greatest of the MAV, current AV, net premium paid and premiums (adjusted for withdrawals) accumulated at generally 5%
simple interest up to the earlier of age 80 or 100% of adjusted premiums.
[3] EPB GMDB is the greatest of the MAV, current AV, or contract value plus a percentage of the contract’s growth. The contract’s growth is AV
less premiums net of withdrawals, subject to a cap of 200% of premiums net of withdrawals.
[4] APB GMDB is the greater of current AV or MAV, not to exceed current AV plus 25% times the greater of net premiums and MAV (each adjusted
for premiums in the past 12 months).
[5] LIB GMDB is the greatest of current AV, net premiums paid, or for certain contracts a benefit amount that ratchets over time, generally based
on market performance.
[6] Reset GMDB is the greatest of current AV, net premiums paid and the most recent five to seven year anniversary AV before age 80 (adjusted for
withdrawals).
[7] ROP GMDB is the greater of current AV or net premiums paid.
[8] AV includes the contract holder’s investment in the separate account and the general account.
[9] GMDB includes a ROP and MAV (before age 80) paid in a single lump sum. GMIB is a guarantee to return initial investment, adjusted for
earnings liquidity which allows for free withdrawal of earnings, paid through a fixed payout annuity, after a minimum deferral period of 10, 15
or 20 years. The GRB related to the Japan GMIB was $34.1 billion and $33.9 billion as of December 31, 2011 and December 31, 2010,
respectively. The GRB related to the Japan GMAB and GMWB was $701 as of December 31, 2011 and $707 as of December 31, 2010. These
liabilities are not included in the Separate Account as they are not legally insulated from the general account liabilities of the insurance
enterprise. As of December 31, 2011, 55 % of the GMDB RNAR and 65% of the GMIB NAR is reinsured to a Hartford affiliate.
[10] NAR is defined as the guaranteed benefit in excess of the current AV. RNAR represents NAR reduced for reinsurance. NAR and RNAR are
highly sensitive to equity markets movements and increase when equity markets decline. Additionally Japan's NAR and RNAR are highly
sensitive to currency movements and increase when the Yen strengthens.
[11] Policies with a guaranteed living benefit (GMIB in Japan) also have a guaranteed death benefit. The NAR for each benefit is shown in the table
above, however these benefits are not additive. When a policy terminates due to death, any NAR related to GMWB or GMIB is released.
Similarly, when a policy goes into benefit status on a GMWB or GMIB, its GMDB NAR is released.
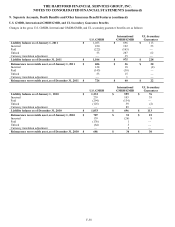
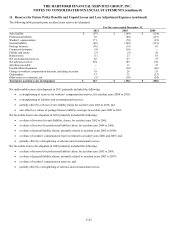
In the U.S., account balances of contracts with guarantees were invested in variable separate accounts as follows:
Asset type
As of December 31, 2011
As of December 31, 2010
Equity securities (including mutual funds)
$
61,472
$
75,601
Cash and cash equivalents
7,516
8,365
Total
$
68,988
$
83,966
As of December 31, 2011 and December 31, 2010, approximately 17% and 15%, respectively, of the equity securities above were
invested in fixed income securities through these funds and approximately 83% and 85%, respectively, were invested in equity
securities.
See Note 4 for further information on guaranteed living benefits that are accounted for at fair value, such as GMWB.