The Hartford 2011 Annual Report Download - page 163
Download and view the complete annual report
Please find page 163 of the 2011 The Hartford annual report below. You can navigate through the pages in the report by either clicking on the pages listed below, or by using the keyword search tool below to find specific information within the annual report.-
 1
1 -
2
-
3
-
4
-
5
-
6
-
7
-
8
-
9
-
10
-
11
-
12
-
13
-
14
-
15
-
16
-
17
-
18
-
19
-
20
-
21
-
22
-
23
-
24
-
25
-
26
-
27
-
28
-
29
-
30
-
31
-
32
-
33
-
34
-
35
-
36
-
37
-
38
-
39
-
40
-
41
-
42
-
43
-
44
-
45
-
46
-
47
-
48
-
49
-
50
-
51
-
52
-
53
-
54
-
55
-
56
-
57
-
58
-
59
-
60
-
61
-
62
-
63
-
64
-
65
-
66
-
67
-
68
-
69
-
70
-
71
-
72
-
73
-
74
-
75
-
76
-
77
-
78
-
79
-
80
-
81
-
82
-
83
-
84
-
85
-
86
-
87
-
88
-
89
-
90
-
91
-
92
-
93
-
94
-
95
-
96
-
97
-
98
-
99
-
100
-
101
-
102
-
103
-
104
-
105
-
106
-
107
-
108
-
109
-
110
-
111
-
112
-
113
-
114
-
115
-
116
-
117
-
118
-
119
-
120
-
121
-
122
-
123
-
124
-
125
-
126
-
127
-
128
-
129
-
130
-
131
-
132
-
133
-
134
-
135
-
136
-
137
-
138
-
139
-
140
-
141
-
142
-
143
-
144
-
145
-
146
-
147
-
148
-
149
-
150
-
151
-
152
-
 153
153 -
 154
154 -
 155
155 -
 156
156 -
 157
157 -
 158
158 -
 159
159 -
 160
160 -
 161
161 -
 162
162 -
 163
163 -
 164
164 -
 165
165 -
 166
166 -
 167
167 -
 168
168 -
 169
169 -
 170
170 -
 171
171 -
 172
172 -
 173
173 -
174
-
175
-
176
-
177
-
178
-
179
-
180
-
181
-
182
-
183
-
184
-
185
-
186
-
187
-
188
-
189
-
190
-
191
-
192
-
193
-
194
-
195
-
196
-
197
-
198
-
199
-
200
-
201
-
202
-
203
-
204
-
205
-
206
-
207
-
208
-
209
-
210
-
211
-
212
-
213
-
214
-
215
-
216
-
217
-
218
-
219
-
220
-
221
-
222
-
223
-
224
-
225
-
226
-
227
-
228
-
229
-
230
-
231
-
232
-
233
-
234
-
235
-
236
-
237
-
238
-
239
-
240
-
241
-
242
-
243
-
244
-
245
-
246
-
247
-
248
 |
 |

THE HARTFORD FINANCIAL SERVICES GROUP, INC.
NOTES TO CONSOLIDATED FINANCIAL STATEMENTS (continued)
F-28
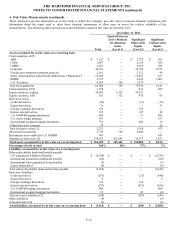
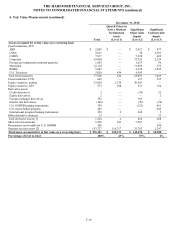
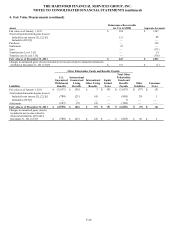
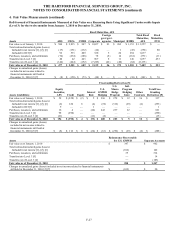
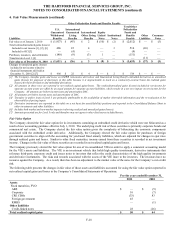
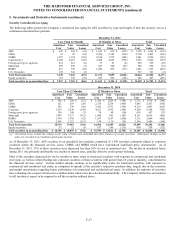
4. Fair Value Measurements (continued)
Other Policyholder Funds and Benefits Payable
Liabilities
U.S.
Guaranteed
Withdrawal
Benefits
International
Guaranteed
Living
Benefits
Int
ernational
Other Living
Benefits
Equity
Linked
Notes
Institutional
Notes
Total Other
Policyholder
Funds and
Benefits
Payable
Other
Liabilities
Consumer
Notes
Fair value as of January 1, 2010
$
(1,957)
$
(45)
$
2
$
(10)
$
(2)
$
(2,012)
$
—
$
(5)
Total realized/unrealized gains (losses)
Included in net income [1], [2], [6]
486
22
4
—
2
514
(26)
—
Included in OCI [3]
—
(4)
—
—
—
(4)
—
—
Purchases, issuances, and settlements
(140)
(9)
(3)
1
—
(151)
—
—
Transfers into Level 3 [4]
—
—
—
—
—
—
(11)
—
Fair value as of December 31, 2010 $
(1,611)
$
(36)
$
3
$
(9)
$
—
$
(1,653)
$
(37)
$
(5)
Changes in unrealized gains (losses)
included in net income related to
financial instruments still held at
December 31, 2010 [2] [7]
$
486
$
22
$
4
$
—
$
2
$
514
$
—
$
—
[1] The Company classifies gains and losses on GMWB reinsurance derivatives and Guaranteed Living Benefit embedded derivatives as unrealized
gains (losses) for purposes of disclosure in this table because it is impracticable to track on a contract-by-contract basis the realized gains
(losses) for these derivatives and embedded derivatives.
[2] All amounts in these rows are reported in net realized capital gains/losses. The realized/unrealized gains (losses) included in net income for
separate account assets are offset by an equal amount for separate account liabilities, which results in a net zero impact on net income for the
Company. All amounts are before income taxes and amortization DAC.
[3] All amounts are before income taxes and amortization of DAC.
[4] Transfers in and/or (out) of Level 3 are primarily attributable to the availability of market observable information and the re-evaluation of the
observability of pricing inputs.
[5] Derivative instruments are reported in this table on a net basis for asset/(liability) positions and reported in the Consolidated Balance Sheet in
other investments and other liabilities.
[6] Includes both market and non-market impacts in deriving realized and unrealized gains (losses).
[7] Amounts presented are for Level 3 only and therefore may not agree to other disclosures included herein.
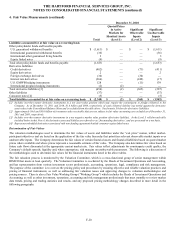
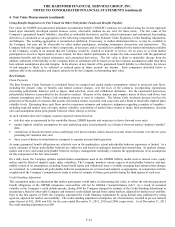
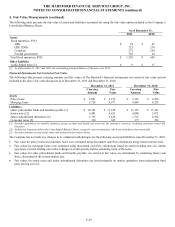
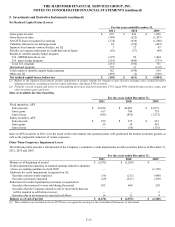
Fair Value Option
The Company elected the fair value option for its investments containing an embedded credit derivative which were not bifurcated as a
result of new accounting guidance effective July 1, 2010. The underlying credit risk of these securities is primarily corporate bonds and
commercial real estate. The Company elected the fair value option given the complexity of bifurcating the economic components
associated with the embedded credit derivative. Additionally, the Company elected the fair value option for purchases of foreign
government securities to align with the accounting for yen-based fixed annuity liabilities, which are adjusted for changes in spot rates
through realized gains and losses. Similar to other fixed maturities, income earned from these securities is recorded in net investment
income. Changes in the fair value of these securities are recorded in net realized capital gains and losses.
The Company previously elected the fair value option for one of its consolidated VIEs in order to apply a consistent accounting model
for the VIE’ s assets and liabilities. The VIE is an investment vehicle that holds high quality investments, derivative instruments that
reference third-party corporate credit and issues notes to investors that reflect the credit characteristics of the high quality investments
and derivative instruments. The risks and rewards associated with the assets of the VIE inure to the investors. The investors have no
recourse against the Company. As a result, there has been no adjustment to the market value of the notes for the Company’ s own credit
risk.
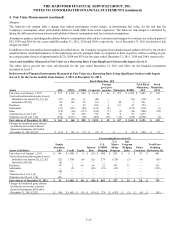
The following table presents the changes in fair value of those assets and liabilities accounted for using the fair value option reported in
net realized capital gains and losses in the Company’ s Consolidated Statements of Operations.
For the years ended December 31,
2011
2010
Assets
Fixed maturities, FVO
ABS
$
—
$
(5)
Corporate
10
(7)
CRE CDOs
(33)
83
Foreign government
45
—
RMBS
—
(1)
Other liabilities
Credit-linked notes
28
(26)
Total realized capital gains
$
50
$
44