The Hartford 2011 Annual Report Download - page 40
Download and view the complete annual report
Please find page 40 of the 2011 The Hartford annual report below. You can navigate through the pages in the report by either clicking on the pages listed below, or by using the keyword search tool below to find specific information within the annual report.-
 1
1 -
2
-
3
-
4
-
5
-
6
-
7
-
8
-
9
-
10
-
11
-
12
-
13
-
14
-
15
-
16
-
17
-
18
-
19
-
20
-
21
-
22
-
23
-
24
-
25
-
26
-
27
-
28
-
29
-
 30
30 -
 31
31 -
 32
32 -
 33
33 -
 34
34 -
 35
35 -
 36
36 -
 37
37 -
 38
38 -
 39
39 -
 40
40 -
 41
41 -
 42
42 -
 43
43 -
 44
44 -
 45
45 -
 46
46 -
 47
47 -
 48
48 -
 49
49 -
 50
50 -
51
-
52
-
53
-
54
-
55
-
56
-
57
-
58
-
59
-
60
-
61
-
62
-
63
-
64
-
65
-
66
-
67
-
68
-
69
-
70
-
71
-
72
-
73
-
74
-
75
-
76
-
77
-
78
-
79
-
80
-
81
-
82
-
83
-
84
-
85
-
86
-
87
-
88
-
89
-
90
-
91
-
92
-
93
-
94
-
95
-
96
-
97
-
98
-
99
-
100
-
101
-
102
-
103
-
104
-
105
-
106
-
107
-
108
-
109
-
110
-
111
-
112
-
113
-
114
-
115
-
116
-
117
-
118
-
119
-
120
-
121
-
122
-
123
-
124
-
125
-
126
-
127
-
128
-
129
-
130
-
131
-
132
-
133
-
134
-
135
-
136
-
137
-
138
-
139
-
140
-
141
-
142
-
143
-
144
-
145
-
146
-
147
-
148
-
149
-
150
-
151
-
152
-
153
-
154
-
155
-
156
-
157
-
158
-
159
-
160
-
161
-
162
-
163
-
164
-
165
-
166
-
167
-
168
-
169
-
170
-
171
-
172
-
173
-
174
-
175
-
176
-
177
-
178
-
179
-
180
-
181
-
182
-
183
-
184
-
185
-
186
-
187
-
188
-
189
-
190
-
191
-
192
-
193
-
194
-
195
-
196
-
197
-
198
-
199
-
200
-
201
-
202
-
203
-
204
-
205
-
206
-
207
-
208
-
209
-
210
-
211
-
212
-
213
-
214
-
215
-
216
-
217
-
218
-
219
-
220
-
221
-
222
-
223
-
224
-
225
-
226
-
227
-
228
-
229
-
230
-
231
-
232
-
233
-
234
-
235
-
236
-
237
-
238
-
239
-
240
-
241
-
242
-
243
-
244
-
245
-
246
-
247
-
248
 |
 |

40
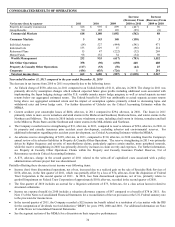
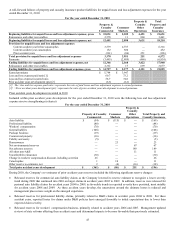
Reinsurance recoverables include an estimate of the amount of gross loss and loss adjustment expense reserves that may be ceded under
the terms of the reinsurance agreements, including IBNR unpaid losses. The Company calculates its ceded reinsurance projection based
on the terms of any applicable facultative and treaty reinsurance, often including an estimate by reinsurance agreement of how IBNR
losses will ultimately be ceded.
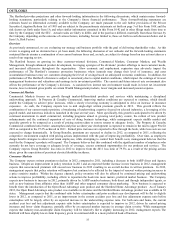
The Company provides an allowance for uncollectible reinsurance, reflecting management’ s best estimate of reinsurance cessions that
may be uncollectible in the future due to reinsurers’ unwillingness or inability to pay. The Company analyzes recent developments in
commutation activity between reinsurers and cedants, recent trends in arbitration and litigation outcomes in disputes between reinsurers
and cedants and the overall credit quality of the Company’ s reinsurers. Where its contracts permit, the Company secures future claim
obligations with various forms of collateral, including irrevocable letters of credit, secured trusts, funds held accounts and group-wide
offsets. The allowance for uncollectible reinsurance was $290 as of December 31, 2011, including $83 related to Property & Casualty
Commercial and $207 related to Property & Casualty Other Operations.
The Company’ s estimate of reinsurance recoverables, net of an allowance for uncollectible reinsurance, is subject to similar risks and
uncertainties as the estimate of the gross reserve for unpaid losses and loss adjustment expenses.
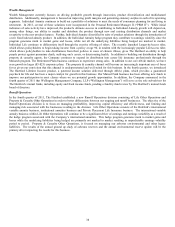
The Hartford, like other insurance companies, categorizes and tracks its insurance reserves for its segments by “line of business”.
Furthermore, The Hartford regularly reviews the appropriateness of reserve levels at the line of business level, taking into consideration
the variety of trends that impact the ultimate settlement of claims for the subsets of claims in each particular line of business. In
addition, Property & Casualty Other Operations categorizes reserves as asbestos and environmental (“A&E”), whereby the Company
reviews these reserve levels by type of event, rather than by line of business. Adjustments to previously established reserves, which
may be material, are reflected in the operating results of the period in which the adjustment is determined to be necessary. In the
judgment of management, information currently available has been properly considered in the reserves established for losses and loss
adjustment expenses.
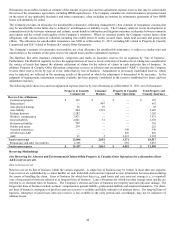
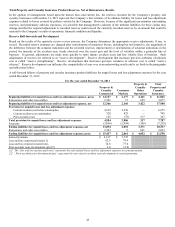
The following table shows loss and loss adjustment expense reserves by line of business as of December 31, 2011, net of reinsurance:
Property & Casualty
Commercial
Consumer
Markets
Property & Casualty
Other Operations
Total Property and
Casualty Insurance
Reserve Line of Business
Commercial property
$
187
$
—
$
—
$
187
Homeowners’
—
467
—
467
Auto physical damage
16
29
—
45
Auto liability
564
1,523
—
2,087
Package business
1,282
—
— 1,282
Workers’ compensation
7,471
—
—
7,471
General liability
2,641
31
—
2,672
Professional liability
702
—
—
702
Fidelity and surety
210
—
—
210
Assumed reinsurance
—
—
349
349
All other non-A&E
—
—
810
810
A&E
21
2
2,212
2,235
Total reserves-net
13,094
2,052
3,371
18,517
Reinsurance and other recoverables
2,343
9
681
3,033
Total reserves-gross
$
15,437
$
2,061
$
4,052
$
21,550
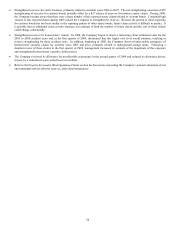
Reserving Methodology
(See Reserving for Asbestos and Environmental Claims within Property & Casualty Other Operations for a discussion of how
A&E reserves are set)
How reserves are set
Reserves are set by line of business within the various segments. A single line of business may be written in more than one segment.
Case reserves are established by a claims handler on each individual claim and are adjusted as new information becomes known during
the course of handling the claim. Lines of business for which loss data (e.g., paid losses and case reserves) emerge (i.e., is reported)
over a long period of time are referred to as long-tail lines of business. Lines of business for which loss data emerge more quickly are
referred to as short-tail lines of business. The Company’ s shortest-tail lines of business are property and auto physical damage. The
longest tail lines of business include workers’ compensation, general liability, professional liability and assumed reinsurance. For short-
tail lines of business, emergence of paid loss and case reserves is credible and likely indicative of ultimate losses. For long-tail lines of
business, emergence of paid losses and case reserves is less credible in the early periods and, accordingly, may not be indicative of
ultimate losses.