The Hartford 2011 Annual Report Download - page 90
Download and view the complete annual report
Please find page 90 of the 2011 The Hartford annual report below. You can navigate through the pages in the report by either clicking on the pages listed below, or by using the keyword search tool below to find specific information within the annual report.-
 1
1 -
2
-
3
-
4
-
5
-
6
-
7
-
8
-
9
-
10
-
11
-
12
-
13
-
14
-
15
-
16
-
17
-
18
-
19
-
20
-
21
-
22
-
23
-
24
-
25
-
26
-
27
-
28
-
29
-
30
-
31
-
32
-
33
-
34
-
35
-
36
-
37
-
38
-
39
-
40
-
41
-
42
-
43
-
44
-
45
-
46
-
47
-
48
-
49
-
50
-
51
-
52
-
53
-
54
-
55
-
56
-
57
-
58
-
59
-
60
-
61
-
62
-
63
-
64
-
65
-
66
-
67
-
68
-
69
-
70
-
71
-
72
-
73
-
74
-
75
-
76
-
77
-
78
-
79
-
 80
80 -
 81
81 -
 82
82 -
 83
83 -
 84
84 -
 85
85 -
 86
86 -
 87
87 -
 88
88 -
 89
89 -
 90
90 -
 91
91 -
 92
92 -
 93
93 -
 94
94 -
 95
95 -
 96
96 -
 97
97 -
 98
98 -
 99
99 -
 100
100 -
101
-
102
-
103
-
104
-
105
-
106
-
107
-
108
-
109
-
110
-
111
-
112
-
113
-
114
-
115
-
116
-
117
-
118
-
119
-
120
-
121
-
122
-
123
-
124
-
125
-
126
-
127
-
128
-
129
-
130
-
131
-
132
-
133
-
134
-
135
-
136
-
137
-
138
-
139
-
140
-
141
-
142
-
143
-
144
-
145
-
146
-
147
-
148
-
149
-
150
-
151
-
152
-
153
-
154
-
155
-
156
-
157
-
158
-
159
-
160
-
161
-
162
-
163
-
164
-
165
-
166
-
167
-
168
-
169
-
170
-
171
-
172
-
173
-
174
-
175
-
176
-
177
-
178
-
179
-
180
-
181
-
182
-
183
-
184
-
185
-
186
-
187
-
188
-
189
-
190
-
191
-
192
-
193
-
194
-
195
-
196
-
197
-
198
-
199
-
200
-
201
-
202
-
203
-
204
-
205
-
206
-
207
-
208
-
209
-
210
-
211
-
212
-
213
-
214
-
215
-
216
-
217
-
218
-
219
-
220
-
221
-
222
-
223
-
224
-
225
-
226
-
227
-
228
-
229
-
230
-
231
-
232
-
233
-
234
-
235
-
236
-
237
-
238
-
239
-
240
-
241
-
242
-
243
-
244
-
245
-
246
-
247
-
248
 |
 |

90
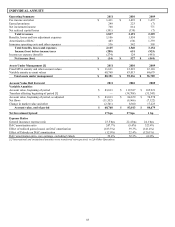
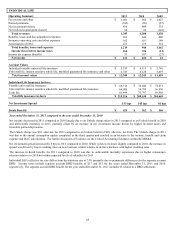
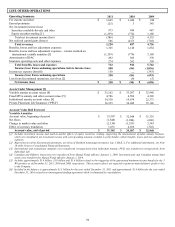
LIFE OTHER OPERATIONS
Operating Summary
2011
2010
2009
Fee income and other
$
1,045
$
1,046
$
948
Earned premiums
(25)
3
345
Net investment income (loss)
Securities available-for-sale and other
973
999
947
Equity securities trading [1]
(1,359)
(774)
3,188
Total net investment income (loss)
(386)
225
4,135
Net realized capital gains (losses)
586
(417)
(702)
Total revenues
1,220
857
4,726
Benefits, losses and loss adjustment expenses
1,305
1,148
1,854
Benefits, losses and loss adjustment expenses – returns credited on
international variable annuities [1]
(1,359)
(774)
3,188
Amortization of DAC
492
305
370
Insurance operating costs and other expenses
274
262
350
Total benefits, losses and expenses
712
941
5,762
Income (loss) from continuing operations, before income taxes
508
(84)
(1,036)
Income tax expense (benefit)
150
—
(343)
Income (loss) from continuing operations
358
(84)
(693)
Loss from discontinued operations, net of tax [2]
—
(6)
(5)
Net income (loss)
$
358
$
(90)
$
(698)
Assets Under Management [3]
Variable annuity account values [4]
$
31,162
$
33,507
$
32,948
Fixed MVA annuity and other account values [5]
4,786
4,596
4,365
Institutional annuity account values [6]
19,330
19,674
22,373
Private Placement Life Insurance (“PPLI”)
36,335
36,042
35,146
Account Value Roll Forward
Variable Annuities
Account value, beginning of period
$
33,507
$
32,948
$
31,335
Net flows
(1,848)
(1,946)
(606)
Change in market value and other
(2,130)
(1,531)
2,545
Effect of currency translation
1,633
4,036
(326)
Account value, end of period
$
31,162
$
33,507
$
32,948
[1] Includes investment income and mark-to-market effects of equity securities, trading, supporting the international variable annuity business,
which are classified in net investment income with corresponding amounts credited to policyholders within benefits, losses and loss adjustment
expenses.
[2] Represents loss from discontinued operations, net of tax of Hartford Advantage investment, Ltd. (“HAIL”). For additional information, see Note
20 of the Notes to Consolidated Financial Statements.
[3] International and institutional annuities were transferred retrospectively from Individual Annuity; PPLI was transferred retrospectively from
Individual Life.
[4] Canadian and Offshore businesses were transferred from Mutual Funds effective January 1, 2009. Investment-only and Canadian mutual fund
assets were transferred to Mutual Funds effective January 1, 2010.
[5] Includes approximately $1.9 billion, $1.9 billion and $1.8 billion related to the triggering of the guaranteed minimum income benefit for the 3
Win product as of December 31, 2011, 2010 and 2009, respectively. This account value is not expected to generate material future profit or loss
to the Company.
[6] Included in the balance is approximately $1.3 billion for the year ended December 31, 2011 and approximately $1.4 billion for the year ended
December 31, 2010 related to an intrasegment funding agreement which is eliminated in consolidation.