The Hartford 2011 Annual Report Download - page 68
Download and view the complete annual report
Please find page 68 of the 2011 The Hartford annual report below. You can navigate through the pages in the report by either clicking on the pages listed below, or by using the keyword search tool below to find specific information within the annual report.68
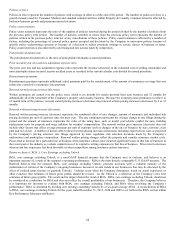
Policies in force
Policies in force represent the number of policies with coverage in effect as of the end of the period. The number of policies in force is a
growth measure used for Consumer Markets and standard commercial lines within Property & Casualty Commercial and is affected by
both new business growth and premium renewal retention.
Policy count retention
Policy count retention represents the ratio of the number of policies renewed during the period divided by the number of policies from
the previous policy term period. The number of policies available to renew from the previous policy term represents the number of
policies written in the previous policy term net of any cancellations of those policies. Policy count retention is affected by a number of
factors, including the percentage of renewal policy quotes accepted and decisions by the Company to non-renew policies because of
specific policy underwriting concerns or because of a decision to reduce premium writings in certain classes of business or states.
Policy count retention is also affected by advertising and rate actions taken by competitors.
Policyholder dividend ratio
The policyholder dividend ratio is the ratio of policyholder dividends to earned premium.
Prior accident year loss and loss adjustment expense ratio
The prior year loss and loss adjustment expense ratio represents the increase (decrease) in the estimated cost of settling catastrophe and
non-catastrophe claims incurred in prior accident years as recorded in the current calendar year divided by earned premiums.
Reinstatement premiums
Reinstatement premium represents additional ceded premium paid for the reinstatement of the amount of reinsurance coverage that was
reduced as a result of a reinsurance loss payment.
Renewal earned pricing increase (decrease)
Written premiums are earned over the policy term, which is six months for certain personal lines auto business and 12 months for
substantially all of the remainder of the Company’ s property and casualty business. Because the Company earns premiums over the 6 to
12 month term of the policies, renewal earned pricing increases (decreases) lag renewal written pricing increases (decreases) by 6 to 12
months.
Renewal written pricing increase (decrease)
Renewal written pricing increase (decrease) represents the combined effect of rate changes, amount of insurance and individual risk
pricing decisions per unit of exposure since the prior year. The rate component represents the average change in rate filings during the
period and the amount of insurance represents the value of the rating base, such as model year/vehicle symbol for auto, building
replacement costs for property and wage inflation for workers' compensation. The renewal written price increase (decrease) does not
include other factors that affect average premium per unit of exposure such as changes in the mix of business by state, territory, class
plan and tier of risk. A number of factors affect renewal written pricing increases (decreases) including expected loss costs as projected
by the Company’ s pricing actuaries, rate filings approved by state regulators, risk selection decisions made by the Company’ s
underwriters and marketplace competition. Renewal written pricing changes reflect the property and casualty insurance market cycle.
Prices tend to increase for a particular line of business when insurance carriers have incurred significant losses in that line of business in
the recent past or the industry as a whole commits less of its capital to writing exposures in that line of business. Prices tend to decrease
when recent loss experience has been favorable or when competition among insurance carriers increases.
Return on Assets (“ROA”), Core Earnings excluding Unlock
ROA, core earnings excluding Unlock, is a non-GAAP financial measure that the Company uses to evaluate, and believes is an
important measure of, certain of the segment’ s operating performance. ROA is the most directly comparable U.S. GAAP measure. The
Hartford believes that the measure ROA, core earnings excluding Unlock, provides investors with a valuable measure of the
performance of certain of the Company’ s on-going businesses because it reveals trends in our businesses that may be obscured by the
effect of realized gains (losses) or quarterly Unlocks. Unlocks occur when the Company determines, based on actual experience or
other evidence, that estimates of future gross profits should be revised. As the Unlock is a reflection of the Company’ s new best
estimates of future gross profits. The result and its impact distort the trend of ROA. ROA, core earnings excluding Unlock, should not
be considered as a substitute for ROA and does not reflect the overall profitability of our businesses. Therefore, the Company believes
it is important for investors to evaluate both ROA, core earnings excluding Unlock, and ROA when reviewing the Company’ s
performance. ROA is calculated by dividing core earnings excluding Unlocks by a two-point average AUM. A reconciliation of ROA
to ROA, core earnings excluding Unlock for the years ended December 31, 2011, 2010 and 2009 is set forth in the ROA section within
Key Performance Measures and Ratios.


