The Hartford 2011 Annual Report Download - page 35
Download and view the complete annual report
Please find page 35 of the 2011 The Hartford annual report below. You can navigate through the pages in the report by either clicking on the pages listed below, or by using the keyword search tool below to find specific information within the annual report.-
 1
1 -
2
-
3
-
4
-
5
-
6
-
7
-
8
-
9
-
10
-
11
-
12
-
13
-
14
-
15
-
16
-
17
-
18
-
19
-
20
-
21
-
22
-
23
-
24
-
 25
25 -
 26
26 -
 27
27 -
 28
28 -
 29
29 -
 30
30 -
 31
31 -
 32
32 -
 33
33 -
 34
34 -
 35
35 -
 36
36 -
 37
37 -
 38
38 -
 39
39 -
 40
40 -
 41
41 -
 42
42 -
 43
43 -
 44
44 -
 45
45 -
46
-
47
-
48
-
49
-
50
-
51
-
52
-
53
-
54
-
55
-
56
-
57
-
58
-
59
-
60
-
61
-
62
-
63
-
64
-
65
-
66
-
67
-
68
-
69
-
70
-
71
-
72
-
73
-
74
-
75
-
76
-
77
-
78
-
79
-
80
-
81
-
82
-
83
-
84
-
85
-
86
-
87
-
88
-
89
-
90
-
91
-
92
-
93
-
94
-
95
-
96
-
97
-
98
-
99
-
100
-
101
-
102
-
103
-
104
-
105
-
106
-
107
-
108
-
109
-
110
-
111
-
112
-
113
-
114
-
115
-
116
-
117
-
118
-
119
-
120
-
121
-
122
-
123
-
124
-
125
-
126
-
127
-
128
-
129
-
130
-
131
-
132
-
133
-
134
-
135
-
136
-
137
-
138
-
139
-
140
-
141
-
142
-
143
-
144
-
145
-
146
-
147
-
148
-
149
-
150
-
151
-
152
-
153
-
154
-
155
-
156
-
157
-
158
-
159
-
160
-
161
-
162
-
163
-
164
-
165
-
166
-
167
-
168
-
169
-
170
-
171
-
172
-
173
-
174
-
175
-
176
-
177
-
178
-
179
-
180
-
181
-
182
-
183
-
184
-
185
-
186
-
187
-
188
-
189
-
190
-
191
-
192
-
193
-
194
-
195
-
196
-
197
-
198
-
199
-
200
-
201
-
202
-
203
-
204
-
205
-
206
-
207
-
208
-
209
-
210
-
211
-
212
-
213
-
214
-
215
-
216
-
217
-
218
-
219
-
220
-
221
-
222
-
223
-
224
-
225
-
226
-
227
-
228
-
229
-
230
-
231
-
232
-
233
-
234
-
235
-
236
-
237
-
238
-
239
-
240
-
241
-
242
-
243
-
244
-
245
-
246
-
247
-
248
 |
 |
35
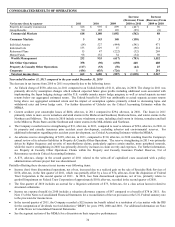
Year ended December 31, 2010 compared to the year ended December 31, 2009
The change from net loss in 2009 to net income in 2010 was primarily due to the following items:
• An Unlock benefit of $111, after-tax, in 2010 compared to an Unlock charge of $1.0 billion, after-tax, in 2009. The Unlock benefit
for 2010 was attributable to actual separate account returns being above our aggregated estimated return and the impact of
assumption updates primarily related to decreasing lapse and withdrawal rates, partially offset by hedging, annuitization estimates
on Japan products, and long-term expected rate of return updates. The Unlock charge for 2009 was primarily driven by actual
separate account returns being significantly below our aggregated estimated return for the first quarter of 2009, partially offset by
actual returns being greater than our aggregated estimated return for the remainder of 2009. For further discussion of Unlocks see
the Critical Accounting Estimates within the MD&A.
• Net realized capital losses decreased primarily due to lower impairment losses, lower valuation allowances on mortgage loans, and
net gains on sales in 2010 compared to net losses on sales in 2009. These changes were partially offset by losses on the variable
annuity hedge program in 2010 compared to gains in 2009. For further discussion, see Net Realized Capital Gains (Losses) within
Investment Results of Key Performance Measures and Ratios of this MD&A.
Partially offsetting these changes in net income (loss) were the following items:
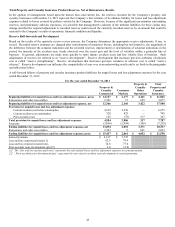
• An asbestos reserve strengthening of $110, after-tax, in 2010, compared to $90, after-tax, in 2009 resulting from the Company's
annual review of its asbestos liabilities within Property & Casualty Other Operations. The reserve strengthening in 2010 and 2009
was primarily driven by increases in claim severity and expenses, particularly attributed to litigation in certain jurisdictions, and, to
a lesser extent, development on primarily peripheral accounts. For further information, see Property & Casualty Other Operations
Claims within the Property and Casualty Insurance Product Reserves, Net of Reinsurance section in Critical Accounting Estimates.
• Current accident year catastrophe losses of $294, after-tax, in 2010 compared to $199, after-tax, in 2009. The losses in 2010,
primarily relate to severe windstorm events, particularly from hail in the Midwest, Plains States and the Southeast and from winter
storms in the Mid-Atlantic and Northeast. The losses in 2009, primarily relate to ice storms, windstorms, and tornadoes across
many states.
• The first quarter of 2010 includes an accrual for a litigation settlement of $73, before-tax, for a class action lawsuit related to
structured settlements.
• The loss from discontinued operations, net of tax, increased in 2010 primarily due to a goodwill impairment on Federal Trust
Corporation of approximately $100, after-tax, partially offset by a net realized capital gain of $41, after-tax, on the sale of the
Hartford Investments Canada Corporation (“HICC”).
• Income tax expense (benefit) in 2010 includes a valuation allowance expense of $87 compared to an expense of $30 in 2009. In
addition, 2009 included nondeductible costs associated with warrants of $78. See Note 13 of the Notes to Consolidated Financial
Statements for a reconciliation of the tax provision at the U.S. Federal statutory rate to the provision for income taxes.
See the segment sections of the MD&A for a discussion on their respective performances.