The Hartford 2011 Annual Report Download - page 117
Download and view the complete annual report
Please find page 117 of the 2011 The Hartford annual report below. You can navigate through the pages in the report by either clicking on the pages listed below, or by using the keyword search tool below to find specific information within the annual report.-
 1
1 -
2
-
3
-
4
-
5
-
6
-
7
-
8
-
9
-
10
-
11
-
12
-
13
-
14
-
15
-
16
-
17
-
18
-
19
-
20
-
21
-
22
-
23
-
24
-
25
-
26
-
27
-
28
-
29
-
30
-
31
-
32
-
33
-
34
-
35
-
36
-
37
-
38
-
39
-
40
-
41
-
42
-
43
-
44
-
45
-
46
-
47
-
48
-
49
-
50
-
51
-
52
-
53
-
54
-
55
-
56
-
57
-
58
-
59
-
60
-
61
-
62
-
63
-
64
-
65
-
66
-
67
-
68
-
69
-
70
-
71
-
72
-
73
-
74
-
75
-
76
-
77
-
78
-
79
-
80
-
81
-
82
-
83
-
84
-
85
-
86
-
87
-
88
-
89
-
90
-
91
-
92
-
93
-
94
-
95
-
96
-
97
-
98
-
99
-
100
-
101
-
102
-
103
-
104
-
105
-
106
-
 107
107 -
 108
108 -
 109
109 -
 110
110 -
 111
111 -
 112
112 -
 113
113 -
 114
114 -
 115
115 -
 116
116 -
 117
117 -
 118
118 -
 119
119 -
 120
120 -
 121
121 -
 122
122 -
 123
123 -
 124
124 -
 125
125 -
 126
126 -
 127
127 -
128
-
129
-
130
-
131
-
132
-
133
-
134
-
135
-
136
-
137
-
138
-
139
-
140
-
141
-
142
-
143
-
144
-
145
-
146
-
147
-
148
-
149
-
150
-
151
-
152
-
153
-
154
-
155
-
156
-
157
-
158
-
159
-
160
-
161
-
162
-
163
-
164
-
165
-
166
-
167
-
168
-
169
-
170
-
171
-
172
-
173
-
174
-
175
-
176
-
177
-
178
-
179
-
180
-
181
-
182
-
183
-
184
-
185
-
186
-
187
-
188
-
189
-
190
-
191
-
192
-
193
-
194
-
195
-
196
-
197
-
198
-
199
-
200
-
201
-
202
-
203
-
204
-
205
-
206
-
207
-
208
-
209
-
210
-
211
-
212
-
213
-
214
-
215
-
216
-
217
-
218
-
219
-
220
-
221
-
222
-
223
-
224
-
225
-
226
-
227
-
228
-
229
-
230
-
231
-
232
-
233
-
234
-
235
-
236
-
237
-
238
-
239
-
240
-
241
-
242
-
243
-
244
-
245
-
246
-
247
-
248
 |
 |

117
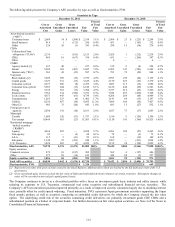
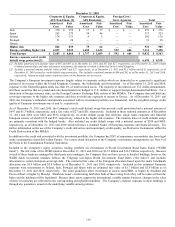
December 31, 2010
AAA AA A BBB BB and Below Total
Amortized
Cost
Fair
Value
Amortized
Cost
Fair
Value
Amortized
Cost
Fair
Value
Amortized
Cost
Fair
Value
Amortized
Cost
Fair
Value
Amortized
Cost
Fair
Value
2003 & Prior
$
782
$
803
$
146
$
142
$
107
$
103
$
24
$
21
$
26
$
22
$
1,085
$
1,091
2004
489
511
35
35
68
61
33
27
6
5
631
639
2005 610 632 131 121 213 177 182 147 123 96 1,259 1,173
2006
1,016
1,050
566
536
256
224
496
416
436
339
2,770
2,565
2007
305
320
278
250
71
55
253
200
278
198
1,185
1,023
2008
55
58
—
—
—
—
—
—
—
—
55
58
Total
$
3,257
$
3,374
$
1,156
$
1,084
$
715
$
620
$
988
$
811
$
869
$
660
$
6,985
$
6,549
Credit
protection
28.8%
22.5%
13.3%
13.8%
8.0%
21.5%
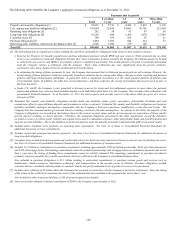
[1] The vintage year represents the year the pool of loans was originated.
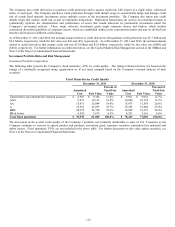
The Company also has AFS exposure to commercial real estate (“CRE”) collateralized debt obligations (“CDOs”) with an amortized
cost and fair value of $485 and $334, respectively, as of December 31, 2011 and $653 and $387, respectively, as of December 31, 2010.
These securities are comprised of diversified pools of commercial mortgage loans or equity positions of other CMBS securitizations.
Although the Company does not plan to invest in this asset class going forward, we continue to monitor these investments as economic
and market uncertainties regarding future performance impacts market liquidity and results in higher risk premiums.
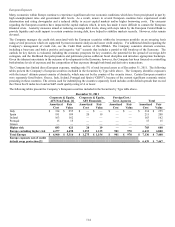
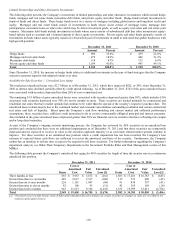
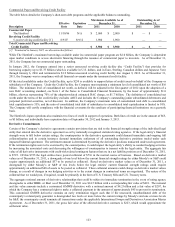
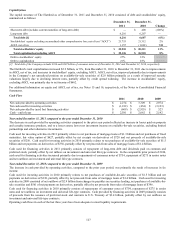
In addition to CMBS bonds and CRE CDOs, the Company has exposure to commercial mortgage loans as presented in the following
table. These loans are collateralized by a variety of commercial properties and are diversified both geographically throughout the
United States and by property type. These loans may be either in the form of a whole loan, where the Company is the sole lender, or a
loan participation. Loan participations are loans where the Company has purchased or retained a portion of an outstanding loan or
package of loans and participates on a pro-rata basis in collecting interest and principal pursuant to the terms of the participation
agreement. In general, A-Note participations have senior payment priority, followed by B-Note participations and then mezzanine loan
participations. As of December 31, 2011, loans within the Company’ s mortgage loan portfolio that have had extensions or
restructurings other than what is allowable under the original terms of the contract are immaterial.
Commercial Mortgage Loans
December 31, 2011
December 31, 2010
Amortized
Cost [1]
Valuation
Allowance
Carrying
Value
Amortized
Cost [1]
Valuation
Allowance
Carrying
Value
Agricultural
$
268
$
(19)
$
249
$
339
$
(23)
$
316
Whole loans
4,892
(17)
4,875
3,326
(23)
3,303
A-Note participations
265
—
265
319
—
319
B-Note participations
296
(66)
230
327
(70)
257
Mezzanine loans
109
—
109
181
(36)
145
Total
$
5,830
$
(102)
$
5,728
$
4,492
$
(152)
$
4,340
[1] Amortized cost represents carrying value prior to valuation allowances, if any.
Since December 31, 2010, the Company funded $1.8 billion of commercial whole loans with a weighted average loan-to-value (“LTV”)
ratio of 62% and a weighted average yield of 4.5%. The Company continues to originate commercial whole loans in primary markets,
such as multi-family and retail, focusing on loans with strong LTV ratios and high quality property collateral. As of December 31,
2011, the Company had mortgage loans held-for-sale with a carrying value and valuation allowance of $74 and $4, respectively, and $87
and $7, respectively, as of December 31, 2010.
Municipal Bonds
The Company holds investments in securities backed by states, municipalities and political subdivisions (“municipal”) with an
amortized cost and fair value of $12.6 billion and $13.3 billion, respectively, as of December 31, 2011 and $12.5 billion and $12.1
billion, respectively, as of December 31, 2010. The Company’ s municipal bond portfolio primarily consists of high quality essential
service revenue and general obligation bonds. As of December 31, 2011, the largest issuer concentrations were the states of California,
Massachusetts and Illinois, which each comprised less than 3% of the municipal bond portfolio and were primarily comprised of general
obligation bonds. As of December 31, 2010, the largest issuer concentrations were the states of California, Massachusetts and Georgia,
which each comprised less than 3% of the municipal bond portfolio and were primarily comprised of general obligation bonds.