The Hartford 2011 Annual Report Download - page 138
Download and view the complete annual report
Please find page 138 of the 2011 The Hartford annual report below. You can navigate through the pages in the report by either clicking on the pages listed below, or by using the keyword search tool below to find specific information within the annual report.-
 1
1 -
2
-
3
-
4
-
5
-
6
-
7
-
8
-
9
-
10
-
11
-
12
-
13
-
14
-
15
-
16
-
17
-
18
-
19
-
20
-
21
-
22
-
23
-
24
-
25
-
26
-
27
-
28
-
29
-
30
-
31
-
32
-
33
-
34
-
35
-
36
-
37
-
38
-
39
-
40
-
41
-
42
-
43
-
44
-
45
-
46
-
47
-
48
-
49
-
50
-
51
-
52
-
53
-
54
-
55
-
56
-
57
-
58
-
59
-
60
-
61
-
62
-
63
-
64
-
65
-
66
-
67
-
68
-
69
-
70
-
71
-
72
-
73
-
74
-
75
-
76
-
77
-
78
-
79
-
80
-
81
-
82
-
83
-
84
-
85
-
86
-
87
-
88
-
89
-
90
-
91
-
92
-
93
-
94
-
95
-
96
-
97
-
98
-
99
-
100
-
101
-
102
-
103
-
104
-
105
-
106
-
107
-
108
-
109
-
110
-
111
-
112
-
113
-
114
-
115
-
116
-
117
-
118
-
119
-
120
-
121
-
122
-
123
-
124
-
125
-
126
-
127
-
 128
128 -
 129
129 -
 130
130 -
 131
131 -
 132
132 -
 133
133 -
 134
134 -
 135
135 -
 136
136 -
 137
137 -
 138
138 -
 139
139 -
 140
140 -
 141
141 -
 142
142 -
 143
143 -
 144
144 -
 145
145 -
 146
146 -
 147
147 -
 148
148 -
149
-
150
-
151
-
152
-
153
-
154
-
155
-
156
-
157
-
158
-
159
-
160
-
161
-
162
-
163
-
164
-
165
-
166
-
167
-
168
-
169
-
170
-
171
-
172
-
173
-
174
-
175
-
176
-
177
-
178
-
179
-
180
-
181
-
182
-
183
-
184
-
185
-
186
-
187
-
188
-
189
-
190
-
191
-
192
-
193
-
194
-
195
-
196
-
197
-
198
-
199
-
200
-
201
-
202
-
203
-
204
-
205
-
206
-
207
-
208
-
209
-
210
-
211
-
212
-
213
-
214
-
215
-
216
-
217
-
218
-
219
-
220
-
221
-
222
-
223
-
224
-
225
-
226
-
227
-
228
-
229
-
230
-
231
-
232
-
233
-
234
-
235
-
236
-
237
-
238
-
239
-
240
-
241
-
242
-
243
-
244
-
245
-
246
-
247
-
248
 |
 |

F-3
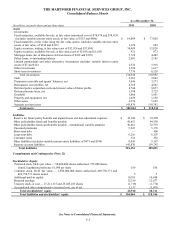
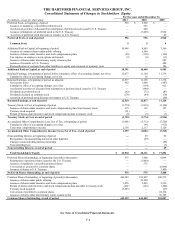
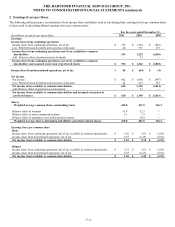
THE HARTFORD FINANCIAL SERVICES GROUP, INC.
Consolidated Statements of Operations
For the years ended December 31,
(In millions, except for per share data)
2011
2010
2009
Revenues
Earned premiums
$
14,088
$
14,055
$
14,424
Fee income
4,750
4,748
4,547
Net investment income:
Securities available-for-sale and other
4,272
4,364
4,017
Equity securities, trading
(1,359)
(774)
3,188
Total net investment income
2,913
3,590
7,205
Net realized capital gains (losses):
Total other-than-temporary impairment ("OTTI") losses
(263)
(852)
(2,191)
OTTI losses recognized in other comprehensive income (“OCI”)
89
418
683
Net OTTI losses recognized in earnings
(174)
(434)
(1,508)
Net realized capital gains (losses), excluding net OTTI losses
recognized in earnings 29 (177) (496)
Total net realized capital losses
(145)
(611)
(2,004)
Other revenues
253
267
261
Total revenues
21,859
22,049
24,433
Benefits, losses and expenses
Benefits, losses and loss adjustment expenses
14,625
13,025
13,831
Benefits, losses and loss adjustment expenses – returns
(1,359)
(774)
3,188
credited on international variable annuities
Amortization of deferred policy acquisition costs and
3,427
2,527
4,257
present value of future profits
Insurance operating costs and other expenses
4,398
4,407
4,370
Interest expense
508
508
476
Goodwill impairment
30
—
32
Total benefits, losses and expenses
21,629
19,693
26,154
Income (loss) from continuing operations before income taxes
230
2,356
(1,721)
Income tax expense (benefit)
(346)
612
(838)
Income (loss) from continuing operations, net of tax
576
1,744
(883)
Income (loss) from discontinued operations, net of tax
86
(64)
(4)
Net income (loss) $ 662 $ 1,680 $ (887)
Preferred stock dividends and accretion of discount
42
515
127
Net income (loss) available to common shareholders
$
620
$
1,165
$
(1,014)
Income (loss) from continuing operations, net of tax, available to common
shareholders per common share
Basic
$
1.20
$
2.85
$
(2.92)
Diluted
$
1.12
$
2.62
$
(2.92)
Net income (loss) available to common shareholders per common share
Basic
$
1.39
$
2.70
$
(2.93)
Diluted
$
1.30
$
2.49
$
(2.93)
Cash dividends declared per common share
$
0.40
$
0.20
$
0.20
See Notes to Consolidated Financial Statements.