The Hartford 2011 Annual Report Download - page 165
Download and view the complete annual report
Please find page 165 of the 2011 The Hartford annual report below. You can navigate through the pages in the report by either clicking on the pages listed below, or by using the keyword search tool below to find specific information within the annual report.-
 1
1 -
2
-
3
-
4
-
5
-
6
-
7
-
8
-
9
-
10
-
11
-
12
-
13
-
14
-
15
-
16
-
17
-
18
-
19
-
20
-
21
-
22
-
23
-
24
-
25
-
26
-
27
-
28
-
29
-
30
-
31
-
32
-
33
-
34
-
35
-
36
-
37
-
38
-
39
-
40
-
41
-
42
-
43
-
44
-
45
-
46
-
47
-
48
-
49
-
50
-
51
-
52
-
53
-
54
-
55
-
56
-
57
-
58
-
59
-
60
-
61
-
62
-
63
-
64
-
65
-
66
-
67
-
68
-
69
-
70
-
71
-
72
-
73
-
74
-
75
-
76
-
77
-
78
-
79
-
80
-
81
-
82
-
83
-
84
-
85
-
86
-
87
-
88
-
89
-
90
-
91
-
92
-
93
-
94
-
95
-
96
-
97
-
98
-
99
-
100
-
101
-
102
-
103
-
104
-
105
-
106
-
107
-
108
-
109
-
110
-
111
-
112
-
113
-
114
-
115
-
116
-
117
-
118
-
119
-
120
-
121
-
122
-
123
-
124
-
125
-
126
-
127
-
128
-
129
-
130
-
131
-
132
-
133
-
134
-
135
-
136
-
137
-
138
-
139
-
140
-
141
-
142
-
143
-
144
-
145
-
146
-
147
-
148
-
149
-
150
-
151
-
152
-
153
-
154
-
 155
155 -
 156
156 -
 157
157 -
 158
158 -
 159
159 -
 160
160 -
 161
161 -
 162
162 -
 163
163 -
 164
164 -
 165
165 -
 166
166 -
 167
167 -
 168
168 -
 169
169 -
 170
170 -
 171
171 -
 172
172 -
 173
173 -
 174
174 -
 175
175 -
176
-
177
-
178
-
179
-
180
-
181
-
182
-
183
-
184
-
185
-
186
-
187
-
188
-
189
-
190
-
191
-
192
-
193
-
194
-
195
-
196
-
197
-
198
-
199
-
200
-
201
-
202
-
203
-
204
-
205
-
206
-
207
-
208
-
209
-
210
-
211
-
212
-
213
-
214
-
215
-
216
-
217
-
218
-
219
-
220
-
221
-
222
-
223
-
224
-
225
-
226
-
227
-
228
-
229
-
230
-
231
-
232
-
233
-
234
-
235
-
236
-
237
-
238
-
239
-
240
-
241
-
242
-
243
-
244
-
245
-
246
-
247
-
248
 |
 |

THE HARTFORD FINANCIAL SERVICES GROUP, INC.
NOTES TO CONSOLIDATED FINANCIAL STATEMENTS (continued)
F-30
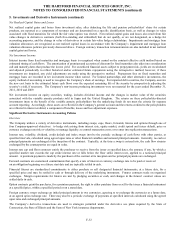
5. Investments and Derivative Instruments
Significant Investment Accounting Policies
Overview
The Company’ s investments in fixed maturities include bonds, redeemable preferred stock and commercial paper. These investments,
along with certain equity securities, which include common and non-redeemable preferred stocks, are classified as AFS and are carried
at fair value. The after-tax difference from cost or amortized cost is reflected in stockholders’ equity as a component of Other
Comprehensive Income (Loss) (“OCI”), after adjustments for the effect of deducting the life and pension policyholders’ share of the
immediate participation guaranteed contracts and certain life and annuity deferred policy acquisition costs and reserve adjustments.
Fixed maturities for which the Company elected the fair value option are classified as FVO and are carried at fair value. The equity
investments associated with the variable annuity products offered in Japan are recorded at fair value and are classified as trading with
changes in fair value recorded in net investment income. Policy loans are carried at outstanding balance. Mortgage loans are recorded
at the outstanding principal balance adjusted for amortization of premiums or discounts and net of valuation allowances. Short-term
investments are carried at amortized cost, which approximates fair value. Limited partnerships and other alternative investments are
reported at their carrying value with the change in carrying value accounted for under the equity method and accordingly the Company’ s
share of earnings are included in net investment income. Recognition of limited partnerships and other alternative investment income is
delayed due to the availability of the related financial information, as private equity and other funds are generally on a three-month
delay and hedge funds are on a one-month delay. Accordingly, income for the years ended December 31, 2011, 2010 and 2009 may not
include the full impact of current year changes in valuation of the underlying assets and liabilities, which are generally obtained from the
limited partnerships and other alternative investments’ general partners. Other investments primarily consist of derivatives instruments
which are carried at fair value.
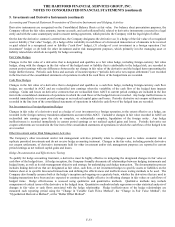
Recognition and Presentation of Other-Than-Temporary Impairments
The Company deems debt securities and certain equity securities with debt-like characteristics (collectively “debt securities”) to be
other-than-temporarily impaired (“impaired”) if a security meets the following conditions: a) the Company intends to sell or it is more
likely than not the Company will be required to sell the security before a recovery in value, or b) the Company does not expect to
recover the entire amortized cost basis of the security. If the Company intends to sell or it is more likely than not the Company will be
required to sell the security before a recovery in value, a charge is recorded in net realized capital losses equal to the difference between
the fair value and amortized cost basis of the security. For those impaired debt securities which do not meet the first condition and for
which the Company does not expect to recover the entire amortized cost basis, the difference between the security’ s amortized cost basis
and the fair value is separated into the portion representing a credit other-than-temporary impairment (“impairment”), which is recorded
in net realized capital losses, and the remaining impairment, which is recorded in OCI. Generally, the Company determines a security's
credit impairment as the difference between its amortized cost basis and its best estimate of expected future cash flows discounted at the
security’ s effective yield prior to impairment. The remaining non-credit impairment, which is recorded in OCI, is the difference
between the security’ s fair value and the Company’ s best estimate of expected future cash flows discounted at the security’ s effective
yield prior to the impairment, which typically represents current market liquidity and risk premiums. The previous amortized cost basis
less the impairment recognized in net realized capital losses becomes the security’ s new cost basis. The Company accretes the new cost
basis to the estimated future cash flows over the expected remaining life of the security by prospectively adjusting the security’ s yield, if
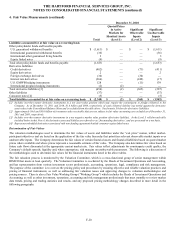
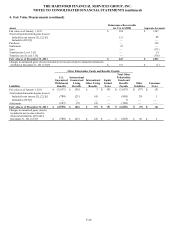
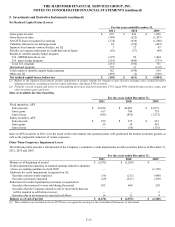
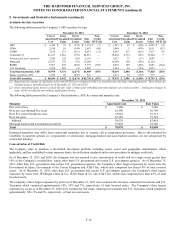
necessary. The following table presents the change in non-credit impairments recognized in OCI as disclosed in the Company’ s
Consolidated Statements of Comprehensive Income (Loss) for the years ended December 31, 2011 and 2010, respectively.
For the years ended December 31,
2011
2010
2009
OTTI losses recognized in OCI
$
(89)
$
(418)
$
(683)
Changes in fair value and/or sales
112
647
244
Tax and deferred acquisition costs
(14)
(113)
215
Change in non-credit impairments recognized in OCI
$
9
$
116
$
(224)