The Hartford 2011 Annual Report Download - page 184
Download and view the complete annual report
Please find page 184 of the 2011 The Hartford annual report below. You can navigate through the pages in the report by either clicking on the pages listed below, or by using the keyword search tool below to find specific information within the annual report.-
 1
1 -
2
-
3
-
4
-
5
-
6
-
7
-
8
-
9
-
10
-
11
-
12
-
13
-
14
-
15
-
16
-
17
-
18
-
19
-
20
-
21
-
22
-
23
-
24
-
25
-
26
-
27
-
28
-
29
-
30
-
31
-
32
-
33
-
34
-
35
-
36
-
37
-
38
-
39
-
40
-
41
-
42
-
43
-
44
-
45
-
46
-
47
-
48
-
49
-
50
-
51
-
52
-
53
-
54
-
55
-
56
-
57
-
58
-
59
-
60
-
61
-
62
-
63
-
64
-
65
-
66
-
67
-
68
-
69
-
70
-
71
-
72
-
73
-
74
-
75
-
76
-
77
-
78
-
79
-
80
-
81
-
82
-
83
-
84
-
85
-
86
-
87
-
88
-
89
-
90
-
91
-
92
-
93
-
94
-
95
-
96
-
97
-
98
-
99
-
100
-
101
-
102
-
103
-
104
-
105
-
106
-
107
-
108
-
109
-
110
-
111
-
112
-
113
-
114
-
115
-
116
-
117
-
118
-
119
-
120
-
121
-
122
-
123
-
124
-
125
-
126
-
127
-
128
-
129
-
130
-
131
-
132
-
133
-
134
-
135
-
136
-
137
-
138
-
139
-
140
-
141
-
142
-
143
-
144
-
145
-
146
-
147
-
148
-
149
-
150
-
151
-
152
-
153
-
154
-
155
-
156
-
157
-
158
-
159
-
160
-
161
-
162
-
163
-
164
-
165
-
166
-
167
-
168
-
169
-
170
-
171
-
172
-
173
-
 174
174 -
 175
175 -
 176
176 -
 177
177 -
 178
178 -
 179
179 -
 180
180 -
 181
181 -
 182
182 -
 183
183 -
 184
184 -
 185
185 -
 186
186 -
 187
187 -
 188
188 -
 189
189 -
 190
190 -
 191
191 -
 192
192 -
 193
193 -
 194
194 -
195
-
196
-
197
-
198
-
199
-
200
-
201
-
202
-
203
-
204
-
205
-
206
-
207
-
208
-
209
-
210
-
211
-
212
-
213
-
214
-
215
-
216
-
217
-
218
-
219
-
220
-
221
-
222
-
223
-
224
-
225
-
226
-
227
-
228
-
229
-
230
-
231
-
232
-
233
-
234
-
235
-
236
-
237
-
238
-
239
-
240
-
241
-
242
-
243
-
244
-
245
-
246
-
247
-
248
 |
 |

THE HARTFORD FINANCIAL SERVICES GROUP, INC.
NOTES TO CONSOLIDATED FINANCIAL STATEMENTS (continued)
F-49
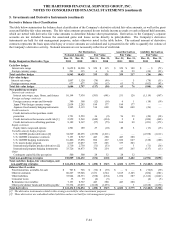
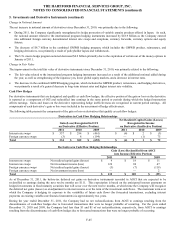
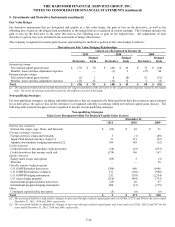
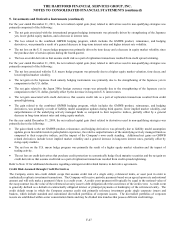
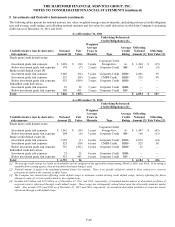
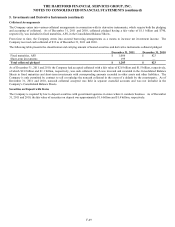
5. Investments and Derivative Instruments (continued)
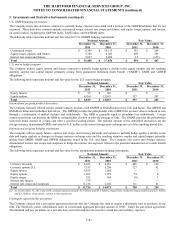
Collateral Arrangements
The Company enters into various collateral arrangements in connection with its derivative instruments, which require both the pledging
and accepting of collateral. As of December 31, 2011 and 2010, collateral pledged having a fair value of $1.1 billion and $790,
respectively, was included in fixed maturities, AFS, in the Consolidated Balance Sheets.
From time to time, the Company enters into secured borrowing arrangements as a means to increase net investment income. The
Company received cash collateral of $33 as of December 31, 2011 and 2010.
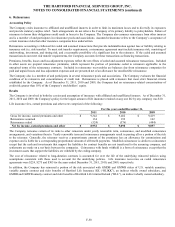
The following table presents the classification and carrying amount of loaned securities and derivative instruments collateral pledged.
December 31, 2011
December 31, 2010
Fixed maturities, AFS
$
1,086
$
823
Short-term investments
199
—
Total collateral pledged
$
1,285
$
823
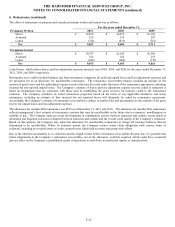
As of December 31, 2011 and 2010, the Company had accepted collateral with a fair value of $2.6 billion and $1.5 billion, respectively,
of which $2.0 billion and $1.1 billion, respectively, was cash collateral which was invested and recorded in the Consolidated Balance
Sheets in fixed maturities and short-term investments with corresponding amounts recorded in other assets and other liabilities. The
Company is only permitted by contract to sell or repledge the noncash collateral in the event of a default by the counterparty. As of
December 31, 2011 and 2010, noncash collateral accepted was held in separate custodial accounts and was not included in the
Company’ s Consolidated Balance Sheets.
Securities on Deposit with States
The Company is required by law to deposit securities with government agencies in states where it conducts business. As of December
31, 2011 and 2010, the fair value of securities on deposit was approximately $1.6 billion and $1.4 billion, respectively.