The Hartford 2011 Annual Report Download - page 229
Download and view the complete annual report
Please find page 229 of the 2011 The Hartford annual report below. You can navigate through the pages in the report by either clicking on the pages listed below, or by using the keyword search tool below to find specific information within the annual report.-
 1
1 -
2
-
3
-
4
-
5
-
6
-
7
-
8
-
9
-
10
-
11
-
12
-
13
-
14
-
15
-
16
-
17
-
18
-
19
-
20
-
21
-
22
-
23
-
24
-
25
-
26
-
27
-
28
-
29
-
30
-
31
-
32
-
33
-
34
-
35
-
36
-
37
-
38
-
39
-
40
-
41
-
42
-
43
-
44
-
45
-
46
-
47
-
48
-
49
-
50
-
51
-
52
-
53
-
54
-
55
-
56
-
57
-
58
-
59
-
60
-
61
-
62
-
63
-
64
-
65
-
66
-
67
-
68
-
69
-
70
-
71
-
72
-
73
-
74
-
75
-
76
-
77
-
78
-
79
-
80
-
81
-
82
-
83
-
84
-
85
-
86
-
87
-
88
-
89
-
90
-
91
-
92
-
93
-
94
-
95
-
96
-
97
-
98
-
99
-
100
-
101
-
102
-
103
-
104
-
105
-
106
-
107
-
108
-
109
-
110
-
111
-
112
-
113
-
114
-
115
-
116
-
117
-
118
-
119
-
120
-
121
-
122
-
123
-
124
-
125
-
126
-
127
-
128
-
129
-
130
-
131
-
132
-
133
-
134
-
135
-
136
-
137
-
138
-
139
-
140
-
141
-
142
-
143
-
144
-
145
-
146
-
147
-
148
-
149
-
150
-
151
-
152
-
153
-
154
-
155
-
156
-
157
-
158
-
159
-
160
-
161
-
162
-
163
-
164
-
165
-
166
-
167
-
168
-
169
-
170
-
171
-
172
-
173
-
174
-
175
-
176
-
177
-
178
-
179
-
180
-
181
-
182
-
183
-
184
-
185
-
186
-
187
-
188
-
189
-
190
-
191
-
192
-
193
-
194
-
195
-
196
-
197
-
198
-
199
-
200
-
201
-
202
-
203
-
204
-
205
-
206
-
207
-
208
-
209
-
210
-
211
-
212
-
213
-
214
-
215
-
216
-
217
-
218
-
 219
219 -
 220
220 -
 221
221 -
 222
222 -
 223
223 -
 224
224 -
 225
225 -
 226
226 -
 227
227 -
 228
228 -
 229
229 -
 230
230 -
 231
231 -
 232
232 -
 233
233 -
 234
234 -
 235
235 -
 236
236 -
 237
237 -
 238
238 -
 239
239 -
240
-
241
-
242
-
243
-
244
-
245
-
246
-
247
-
248
 |
 |

S-1
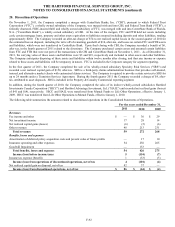
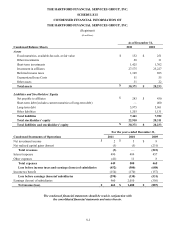
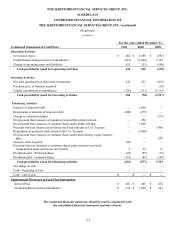
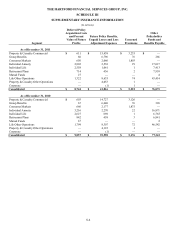
THE HARTFORD FINANCIAL SERVICES GROUP, INC.
SCHEDULE I
SUMMARY OF INVESTMENTS - OTHER THAN INVESTMENTS IN AFFILIATES
(In millions)
As of December 31, 2011
Type of Investment
Cost
Fair Value
Amount at
which shown on
Balance Sheet
Fixed Maturities
Bonds and notes
U.S. government and government agencies and authorities
(guaranteed and sponsored)
$
8,901
$
9,364
$
9,364
States, municipalities and political subdivisions
12,557
13,260
13,260
Foreign governments
2,030
2,161
2,161
Public utilities
8,236
9,055
9,055
All other corporate bonds
32,925
34,956
34,956
All other mortgage-backed and asset-backed securities
14,329
13,013
13,013
Total fixed maturities, available-for-sale
78,978
81,809
81,809
Fixed maturities, at fair value using fair value option
1,501
1,328
1,328
Total fixed maturities
80,479
83,137
83,137
Equity Securities
Common stocks
Industrial, miscellaneous and all other
420
443
443
Non-redeemable preferred stocks
636
478
478
Total equity securities, available-for-sale
1,056
921
921
Equity securities, trading
32,928
30,499
30,499
Total equity securities
33,984
31,420
31,420
Mortgage loans
5,728
5,977
5,728
Policy loans
2,001
2,153
2,001
Investments in partnerships and trusts
2,532
2,532
2,532
Futures, options and miscellaneous
1,316
2,394
2,394
Short-term investments
7,736
7,736
7,736
Total investments
$
133,776
$
135,349
$
134,948