The Hartford 2011 Annual Report Download - page 179
Download and view the complete annual report
Please find page 179 of the 2011 The Hartford annual report below. You can navigate through the pages in the report by either clicking on the pages listed below, or by using the keyword search tool below to find specific information within the annual report.-
 1
1 -
2
-
3
-
4
-
5
-
6
-
7
-
8
-
9
-
10
-
11
-
12
-
13
-
14
-
15
-
16
-
17
-
18
-
19
-
20
-
21
-
22
-
23
-
24
-
25
-
26
-
27
-
28
-
29
-
30
-
31
-
32
-
33
-
34
-
35
-
36
-
37
-
38
-
39
-
40
-
41
-
42
-
43
-
44
-
45
-
46
-
47
-
48
-
49
-
50
-
51
-
52
-
53
-
54
-
55
-
56
-
57
-
58
-
59
-
60
-
61
-
62
-
63
-
64
-
65
-
66
-
67
-
68
-
69
-
70
-
71
-
72
-
73
-
74
-
75
-
76
-
77
-
78
-
79
-
80
-
81
-
82
-
83
-
84
-
85
-
86
-
87
-
88
-
89
-
90
-
91
-
92
-
93
-
94
-
95
-
96
-
97
-
98
-
99
-
100
-
101
-
102
-
103
-
104
-
105
-
106
-
107
-
108
-
109
-
110
-
111
-
112
-
113
-
114
-
115
-
116
-
117
-
118
-
119
-
120
-
121
-
122
-
123
-
124
-
125
-
126
-
127
-
128
-
129
-
130
-
131
-
132
-
133
-
134
-
135
-
136
-
137
-
138
-
139
-
140
-
141
-
142
-
143
-
144
-
145
-
146
-
147
-
148
-
149
-
150
-
151
-
152
-
153
-
154
-
155
-
156
-
157
-
158
-
159
-
160
-
161
-
162
-
163
-
164
-
165
-
166
-
167
-
168
-
 169
169 -
 170
170 -
 171
171 -
 172
172 -
 173
173 -
 174
174 -
 175
175 -
 176
176 -
 177
177 -
 178
178 -
 179
179 -
 180
180 -
 181
181 -
 182
182 -
 183
183 -
 184
184 -
 185
185 -
 186
186 -
 187
187 -
 188
188 -
 189
189 -
190
-
191
-
192
-
193
-
194
-
195
-
196
-
197
-
198
-
199
-
200
-
201
-
202
-
203
-
204
-
205
-
206
-
207
-
208
-
209
-
210
-
211
-
212
-
213
-
214
-
215
-
216
-
217
-
218
-
219
-
220
-
221
-
222
-
223
-
224
-
225
-
226
-
227
-
228
-
229
-
230
-
231
-
232
-
233
-
234
-
235
-
236
-
237
-
238
-
239
-
240
-
241
-
242
-
243
-
244
-
245
-
246
-
247
-
248
 |
 |

THE HARTFORD FINANCIAL SERVICES GROUP, INC.
NOTES TO CONSOLIDATED FINANCIAL STATEMENTS (continued)
F-44
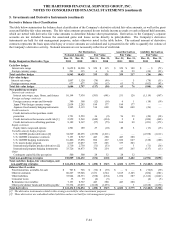
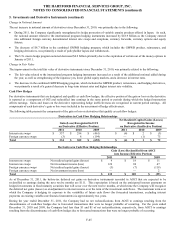
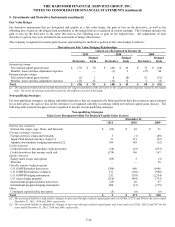
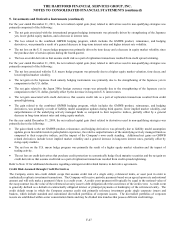
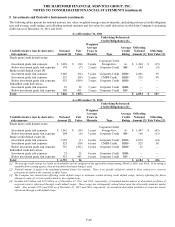
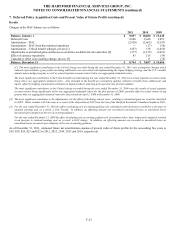
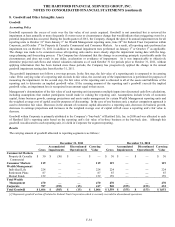
5. Investments and Derivative Instruments (continued)
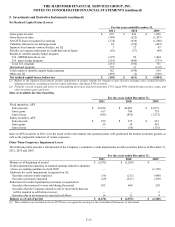
Derivative Balance Sheet Classification
The table below summarizes the balance sheet classification of the Company’ s derivative related fair value amounts, as well as the gross
asset and liability fair value amounts. The fair value amounts presented do not include income accruals or cash collateral held amounts,
which are netted with derivative fair value amounts to determine balance sheet presentation. Derivatives in the Company’ s separate
accounts are not included because the associated gains and losses accrue directly to policyholders. The Company’ s derivative
instruments are held for risk management purposes, unless otherwise noted in the table below. The notional amount of derivative
contracts represents the basis upon which pay or receive amounts are calculated and is presented in the table to quantify the volume of
the Company’ s derivative activity. Notional amounts are not necessarily reflective of credit risk.
Net Derivatives
Asset Derivatives
Liability Derivatives
Notional Amount
Fair Value
Fair Value
Fair Value
Hedge Designation/ Derivative Type
Dec. 31,
2011
Dec. 31,
2010
Dec. 31,
2011
Dec. 31,
2010
Dec. 31,
2011
Dec. 31,
2010
Dec. 31,
2011
Dec. 31,
2010
Cash flow hedges
Interest rate swaps
$
8,652
$
10,290
$
329
$
115
$
329
$
188
$
—
$
(73)
Foreign currency swaps
291
335
6
6
30
29
(24)
(23)
Total cash flow hedges
8,943
10,625
335
121
359
217
(24)
(96)
Fair value hedges
Interest rate swaps
1,007
1,120
(78)
(46)
—
5
(78)
(51)
Foreign currency swaps
677
677
(39)
(12)
63
71
(102)
(83)
Total fair value hedges
1,684
1,797
(117)
(58)
63
76
(180)
(134)
Non-qualifying strategies
Interest rate contracts
Interest rate swaps, caps, floors, and futures
10,144
7,938
(583)
(441)
531
126
(1,114)
(567)
Foreign exchange contracts
Foreign currency swaps and forwards
380
368
(12)
(18)
6
1
(18)
(19)
Japan 3Win foreign currency swaps
2,054
2,285
184
177
184
177
—
—
Japanese fixed annuity hedging instruments
1,945 2,119 514 608 540 608 (26) —
Credit contracts
Credit derivatives that purchase credit
protection 1,721 2,559 36 (9) 56 29 (20) (38)
Credit derivatives that assume credit risk [1]
2,952
2,569
(648)
(434)
2
8
(650)
(442)
Credit derivatives in offsetting positions
8,189
8,367
(57)
(75)
164
98
(221)
(173)
Equity contracts
Equity index swaps and options
1,501
189
27
(10)
40
5
(13)
(15)
Variable annuity hedge program
U.S. GMWB product derivatives [2]
34,569
40,255
(2,538)
(1,611)
—
—
(2,538)
(1,611)
U.S. GMWB reinsurance contracts
7,193
8,767
443
280
443
280
—
—
U.S. GMWB hedging instruments
16,406
17,856
894
467
1,022
647
(128)
(180)
U.S. macro hedge program
6,819
13,057
357
203
357
203
—
—
International program product derivatives [2]
2,710
2,730
(71)
(33)
—
3
(71)
(36)
International program hedging instruments
33,726
14,873
750
254
887
265
(137)
(11)
Other
Contingent capital facility put option
500
500
28
32
28
32
—
—
Total non-qualifying strategies
130,809
124,432
(676)
(610)
4,260
2,482
(4,936)
(3,092)
Total cash flow hedges, fair value hedges, and
non-qualifying strategies
$
141,436
$
136,854
$
(458)
$
(547)
$
4,682
$
2,775
$
(5,140)
$
(3,322)
Balance Sheet Location
Fixed maturities, available-for-sale
$
703
$
728
$
(72)
$
(39)
$
—
$
—
$
(72)
$
(39)
Other investments
60,227
55,948
2,331
1,524
3,165
2,105
(834)
(581)
Other liabilities 35,944 28,333 (538) (654) 1,074 387 (1,612) (1,041)
Consumer notes
35
39
(4)
(5)
—
—
(4)
(5)
Reinsurance recoverables
7,193
8,767
443
280
443
280
—
—
Other policyholder funds and benefits payable
37,334
43,039
(2,618)
(1,653)
—
3
(2,618)
(1,656)
Total derivatives
$
141,436
$
136,854
$
(458)
$
(547)
$
4,682
$
2,775
$
(5,140)
$
(3,322)
[1] The derivative instruments related to this strategy are held for other investment purposes.
[2] These derivatives are embedded within liabilities and are not held for risk management purposes.