The Hartford 2011 Annual Report Download - page 107
Download and view the complete annual report
Please find page 107 of the 2011 The Hartford annual report below. You can navigate through the pages in the report by either clicking on the pages listed below, or by using the keyword search tool below to find specific information within the annual report.-
 1
1 -
2
-
3
-
4
-
5
-
6
-
7
-
8
-
9
-
10
-
11
-
12
-
13
-
14
-
15
-
16
-
17
-
18
-
19
-
20
-
21
-
22
-
23
-
24
-
25
-
26
-
27
-
28
-
29
-
30
-
31
-
32
-
33
-
34
-
35
-
36
-
37
-
38
-
39
-
40
-
41
-
42
-
43
-
44
-
45
-
46
-
47
-
48
-
49
-
50
-
51
-
52
-
53
-
54
-
55
-
56
-
57
-
58
-
59
-
60
-
61
-
62
-
63
-
64
-
65
-
66
-
67
-
68
-
69
-
70
-
71
-
72
-
73
-
74
-
75
-
76
-
77
-
78
-
79
-
80
-
81
-
82
-
83
-
84
-
85
-
86
-
87
-
88
-
89
-
90
-
91
-
92
-
93
-
94
-
95
-
96
-
 97
97 -
 98
98 -
 99
99 -
 100
100 -
 101
101 -
 102
102 -
 103
103 -
 104
104 -
 105
105 -
 106
106 -
 107
107 -
 108
108 -
 109
109 -
 110
110 -
 111
111 -
 112
112 -
 113
113 -
 114
114 -
 115
115 -
 116
116 -
 117
117 -
118
-
119
-
120
-
121
-
122
-
123
-
124
-
125
-
126
-
127
-
128
-
129
-
130
-
131
-
132
-
133
-
134
-
135
-
136
-
137
-
138
-
139
-
140
-
141
-
142
-
143
-
144
-
145
-
146
-
147
-
148
-
149
-
150
-
151
-
152
-
153
-
154
-
155
-
156
-
157
-
158
-
159
-
160
-
161
-
162
-
163
-
164
-
165
-
166
-
167
-
168
-
169
-
170
-
171
-
172
-
173
-
174
-
175
-
176
-
177
-
178
-
179
-
180
-
181
-
182
-
183
-
184
-
185
-
186
-
187
-
188
-
189
-
190
-
191
-
192
-
193
-
194
-
195
-
196
-
197
-
198
-
199
-
200
-
201
-
202
-
203
-
204
-
205
-
206
-
207
-
208
-
209
-
210
-
211
-
212
-
213
-
214
-
215
-
216
-
217
-
218
-
219
-
220
-
221
-
222
-
223
-
224
-
225
-
226
-
227
-
228
-
229
-
230
-
231
-
232
-
233
-
234
-
235
-
236
-
237
-
238
-
239
-
240
-
241
-
242
-
243
-
244
-
245
-
246
-
247
-
248
 |
 |

107
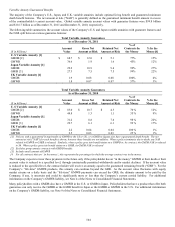
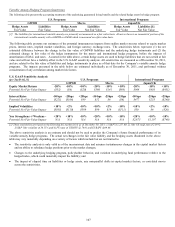
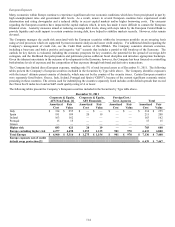
Variable Annuity Hedging Program Sensitivities
The following table presents the accounting treatment of the underlying guaranteed living benefits and the related hedge assets by hedge program.
U.S. Programs
International Programs
GMWB
Macro
Japan/UK
Hedge Assets
Liabilities
Hedge Assets
Liabilities
Hedge Assets
Liabilities [1]
Fair Value
Fair Value
Fair Value
Not Fair Value
Fair Value
Not Fair Value
[1] The liabilities for international variable annuity are primarily not measured on a fair value basis. However there is an immaterial portion of the
international variable annuity with a GMWB or GMAB which is measured on a fair value basis.
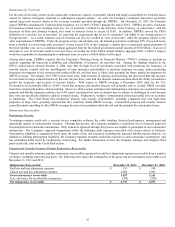
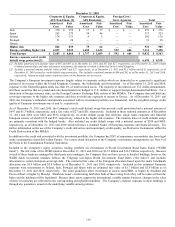
The following table presents our estimates of the potential instantaneous impacts from sudden market stresses related to equity market
prices, interest rates, implied market volatilities, and foreign currency exchange rates. The sensitivities below represent: (1) the net
estimated difference between the change in the fair value of GMWB liabilities and the underlying hedge instruments and (2) the
estimated change in fair value of the hedge instruments for the macro and international hedge programs, before the impacts of
amortization of DAC, and taxes. As noted in the table above, certain hedge assets are used to hedge liabilities that are not carried at fair
value and will not have a liability offset in the U.S. GAAP sensitivity analysis. All sensitivities are measured as of December 30, 2011,
and are related to the fair value of liabilities and hedge instruments in place as of that date for the Company’ s variable annuity hedge
programs. The impacts presented in the table below are estimated individually as of December 30, 2011, and performed without
consideration of any correlation among market risk factors.
U.S. GAAP Sensitivity Analysis
(pre Tax/DAC) [1]
U.S. Programs
International Programs
GMWB
Macro
Japan/UK
Equity Market Return
-20%
-10%
+10%
-20%
-10%
+10%
-20%
-10%
+10%
Potential Net Fair Value Impact
($35)
($4)
($20)
$380
$141
($89)
$908
$456
($451)
Interest Rates
-50 bps
-25bps
+25bps
-50 bps
-25bps
+25bps
-50 bps
-25bps
+25bps
Potential Net Fair Value Impact
($221)
($106)
$99
$12
$6
($6)
$477
$235
($240)
Implied Volatilities
+10%
+2%
-10%
+10%
+2%
-10%
+10%
+2%
-10%
Potential Net Fair Value Impact
($565)
($110)
$509
$90
$19
($111)
$30
$6
($26)
Yen Strengthens +/ Weakens -
+20%
+10%
-10%
+20%
+10%
-10%
+20%
+10%
-10%
Potential Net Fair Value Impact
N/A
N/A
N/A
N/A
N/A
N/A
$2,875
$1,197
($749)
[1] These sensitivities are based on the following key market levels as of December 30, 2011: 1) S&P of 1,257.60; 2) 10yr US swap rate of 2.03%;
3) S&P 10yr volatility of 30.15% and 4) FX rates of USDJPY @ 76.91 and EURJPY @99.66.
The above sensitivity analysis is an estimate and should not be used to predict the Company’ s future financial performance of its
variable annuity hedge programs. The actual net changes in the fair value liability and the hedging assets illustrated in the above
table may vary materially depending on a variety of factors which include but are not limited to:
• The sensitivity analysis is only valid as of the measurement date and assumes instantaneous changes in the capital market factors
and no ability to rebalance hedge positions prior to the market changes;
• Changes to the underlying hedging program, policyholder behavior, and variation in underlying fund performance relative to the
hedged index, which could materially impact the liability; and
• The impact of elapsed time on liabilities or hedge assets, any non-parallel shifts in capital market factors, or correlated moves
across the sensitivities.