The Hartford 2011 Annual Report Download - page 66
Download and view the complete annual report
Please find page 66 of the 2011 The Hartford annual report below. You can navigate through the pages in the report by either clicking on the pages listed below, or by using the keyword search tool below to find specific information within the annual report.-
 1
1 -
2
-
3
-
4
-
5
-
6
-
7
-
8
-
9
-
10
-
11
-
12
-
13
-
14
-
15
-
16
-
17
-
18
-
19
-
20
-
21
-
22
-
23
-
24
-
25
-
26
-
27
-
28
-
29
-
30
-
31
-
32
-
33
-
34
-
35
-
36
-
37
-
38
-
39
-
40
-
41
-
42
-
43
-
44
-
45
-
46
-
47
-
48
-
49
-
50
-
51
-
52
-
53
-
54
-
55
-
 56
56 -
 57
57 -
 58
58 -
 59
59 -
 60
60 -
 61
61 -
 62
62 -
 63
63 -
 64
64 -
 65
65 -
 66
66 -
 67
67 -
 68
68 -
 69
69 -
 70
70 -
 71
71 -
 72
72 -
 73
73 -
 74
74 -
 75
75 -
 76
76 -
77
-
78
-
79
-
80
-
81
-
82
-
83
-
84
-
85
-
86
-
87
-
88
-
89
-
90
-
91
-
92
-
93
-
94
-
95
-
96
-
97
-
98
-
99
-
100
-
101
-
102
-
103
-
104
-
105
-
106
-
107
-
108
-
109
-
110
-
111
-
112
-
113
-
114
-
115
-
116
-
117
-
118
-
119
-
120
-
121
-
122
-
123
-
124
-
125
-
126
-
127
-
128
-
129
-
130
-
131
-
132
-
133
-
134
-
135
-
136
-
137
-
138
-
139
-
140
-
141
-
142
-
143
-
144
-
145
-
146
-
147
-
148
-
149
-
150
-
151
-
152
-
153
-
154
-
155
-
156
-
157
-
158
-
159
-
160
-
161
-
162
-
163
-
164
-
165
-
166
-
167
-
168
-
169
-
170
-
171
-
172
-
173
-
174
-
175
-
176
-
177
-
178
-
179
-
180
-
181
-
182
-
183
-
184
-
185
-
186
-
187
-
188
-
189
-
190
-
191
-
192
-
193
-
194
-
195
-
196
-
197
-
198
-
199
-
200
-
201
-
202
-
203
-
204
-
205
-
206
-
207
-
208
-
209
-
210
-
211
-
212
-
213
-
214
-
215
-
216
-
217
-
218
-
219
-
220
-
221
-
222
-
223
-
224
-
225
-
226
-
227
-
228
-
229
-
230
-
231
-
232
-
233
-
234
-
235
-
236
-
237
-
238
-
239
-
240
-
241
-
242
-
243
-
244
-
245
-
246
-
247
-
248
 |
 |

66
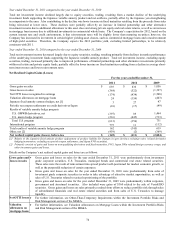
Core Earnings
Core earnings, a non-GAAP measure is an important measure of the Company's operating performance. The Hartford believes that the
measure core earnings provides investors with a valuable measure of the performance of the Company's ongoing businesses because it
reveals trends in our insurance and financial services businesses that may be obscured by including the net effect of certain realized
capital gains and losses and discontinued operations. Some realized capital gains and losses are primarily driven by investment decisions
and external economic developments, the nature and timing of which are unrelated to the insurance and underwriting aspects of our
business. Accordingly, core earnings excludes the effect of all realized gains and losses (net of tax and the effects of deferred policy
acquisition costs ("DAC") that tend to be highly variable from period to period based on capital market conditions. The Hartford
believes, however, that some realized capital gains and losses are integrally related to our insurance operations, so core earnings
includes net realized gains and losses such as net periodic settlements on credit derivatives and net periodic settlements on the Japan
fixed annuity cross-currency swap. These net realized gains and losses are directly related to an offsetting item included in the income
statement such as net investment income. Core earnings is also used by management to assess our operating performance and is one of
the measures considered in determining incentive compensation for the Company's managers. Net income is the most directly
comparable U.S. GAAP measure. Core earnings should not be considered as a substitute for net income and does not reflect the overall
profitability of the Company's business. Therefore, The Hartford believes that it is useful for investors to evaluate both net income and
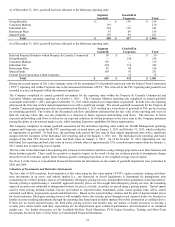
core earnings when reviewing the Company's performance. A reconciliation of net income to core earnings for the years ended
December 31, 2011, 2010 and 2009 is set forth below
For the years ended December 31,
2011
2010
2009
Core earnings
$
970
$
1,972
$
797
Less: Realized gains (losses) excluded from core earnings
(394)
(228)
(1,680)
Less: Discontinued operations
86
(64)
(4)
Net income (loss)
$
662
$
1,680
$
(887)
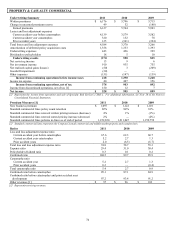
Current accident year loss and loss adjustment expense ratio before catastrophes
The current accident year loss and loss adjustment expense ratio before catastrophes is a measure of the cost of non-catastrophe claims
incurred in the current accident year divided by earned premiums. Management believes that the current accident year loss and loss
adjustment expense ratio before catastrophes is a performance measure that is useful to investors as it removes the impact of volatile and
unpredictable catastrophe losses and prior accident year reserve development.
DAC amortization ratio, Core Earnings excluding Unlock
DAC amortization ratio, core earnings excluding Unlock, is a non-GAAP financial measure that the Company uses to evaluate, and
believes is an important measure of, certain of the segment’ s operating performance. DAC amortization ratio is the most directly
comparable U.S. GAAP measure. The Hartford believes that the measure DAC amortization ratio, core earnings excluding Unlock,
provides investors with a valuable measure of the performance of certain of the Company’s on-going businesses because it reveals
trends in our businesses that may be obscured by the effect of realized gains (losses) or quarterly Unlocks. Unlocks occur when the
Company determines, based on actual experience or other evidence, that estimates of future gross profits should be revised. The Unlock
is a reflection of the Company’ s new best estimates of future gross profits. The result of the Unlock and is impact distort the trend of
DAC amortization ratio. DAC amortization ratio, core earnings excluding Unlock, should not be considered as a substitute for DAC
amortization ratio and does not reflect the overall profitability of our businesses. Therefore, the Company believes it is important for
investors to evaluate both DAC amortization ratio, core earnings excluding Unlock, and DAC amortization ratio when reviewing the
Company’ s performance. DAC amortization ratio, core earnings excluding Unlock is calculated by dividing Core DAC amortization
costs by pre-tax core earnings before DAC amortization costs. A reconciliation of DAC amortization ratio to DAC amortization ratio,
core earnings excluding Unlock for the years ended December 31, 2011, 2010 and 2009 is set forth in the Individual Annuity Operating
Summary with MD&A. For additional information regarding the Unlock, see Critical Accounting Estimates within the MD&A.
Expense ratio
The expense ratio for the underwriting segments of Property & Casualty Commercial and Consumer Markets is the ratio of underwriting
expenses, excluding bad debt expense, to earned premiums. Underwriting expenses include the amortization of deferred policy
acquisition costs and insurance operating costs and expenses. Deferred policy acquisition costs include commissions, taxes, licenses and
fees and other underwriting expenses and are amortized over the policy term.
The expense ratio for the remaining segments is expressed as a ratio of insurance operating costs and expenses to a revenue measure,
depending on the type of business. This calculation excludes the amortization of deferred policy acquisition costs, which is calculated
as a separate ratio, and is discussed below.