The Hartford 2011 Annual Report Download - page 42
Download and view the complete annual report
Please find page 42 of the 2011 The Hartford annual report below. You can navigate through the pages in the report by either clicking on the pages listed below, or by using the keyword search tool below to find specific information within the annual report.-
 1
1 -
2
-
3
-
4
-
5
-
6
-
7
-
8
-
9
-
10
-
11
-
12
-
13
-
14
-
15
-
16
-
17
-
18
-
19
-
20
-
21
-
22
-
23
-
24
-
25
-
26
-
27
-
28
-
29
-
30
-
31
-
 32
32 -
 33
33 -
 34
34 -
 35
35 -
 36
36 -
 37
37 -
 38
38 -
 39
39 -
 40
40 -
 41
41 -
 42
42 -
 43
43 -
 44
44 -
 45
45 -
 46
46 -
 47
47 -
 48
48 -
 49
49 -
 50
50 -
 51
51 -
 52
52 -
53
-
54
-
55
-
56
-
57
-
58
-
59
-
60
-
61
-
62
-
63
-
64
-
65
-
66
-
67
-
68
-
69
-
70
-
71
-
72
-
73
-
74
-
75
-
76
-
77
-
78
-
79
-
80
-
81
-
82
-
83
-
84
-
85
-
86
-
87
-
88
-
89
-
90
-
91
-
92
-
93
-
94
-
95
-
96
-
97
-
98
-
99
-
100
-
101
-
102
-
103
-
104
-
105
-
106
-
107
-
108
-
109
-
110
-
111
-
112
-
113
-
114
-
115
-
116
-
117
-
118
-
119
-
120
-
121
-
122
-
123
-
124
-
125
-
126
-
127
-
128
-
129
-
130
-
131
-
132
-
133
-
134
-
135
-
136
-
137
-
138
-
139
-
140
-
141
-
142
-
143
-
144
-
145
-
146
-
147
-
148
-
149
-
150
-
151
-
152
-
153
-
154
-
155
-
156
-
157
-
158
-
159
-
160
-
161
-
162
-
163
-
164
-
165
-
166
-
167
-
168
-
169
-
170
-
171
-
172
-
173
-
174
-
175
-
176
-
177
-
178
-
179
-
180
-
181
-
182
-
183
-
184
-
185
-
186
-
187
-
188
-
189
-
190
-
191
-
192
-
193
-
194
-
195
-
196
-
197
-
198
-
199
-
200
-
201
-
202
-
203
-
204
-
205
-
206
-
207
-
208
-
209
-
210
-
211
-
212
-
213
-
214
-
215
-
216
-
217
-
218
-
219
-
220
-
221
-
222
-
223
-
224
-
225
-
226
-
227
-
228
-
229
-
230
-
231
-
232
-
233
-
234
-
235
-
236
-
237
-
238
-
239
-
240
-
241
-
242
-
243
-
244
-
245
-
246
-
247
-
248
 |
 |
42
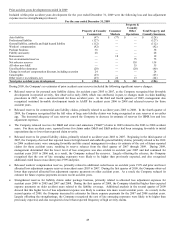
Long-Tailed General Liability, Fidelity and Surety and Large Deductible Workers’ Compensation. For these long-tailed lines of
business, the Company generally relies on the expected loss ratio and reported development techniques. The Company generally
weights these techniques together, relying more heavily on the expected loss ratio method at early ages of development and more on the
reported development method as an accident year matures.
Workers’ Compensation. Workers’ compensation is the Company’ s single largest reserve line of business so a wide range of methods
are reviewed in the reserve analysis. Methods performed include paid and reported development, variations on expected loss ratio
methods, and an in-depth analysis on the largest states. Historically, paid development patterns in the Company’ s workers’
compensation business have been stable, so paid techniques are preferred. Although paid techniques may be less predictive of the
ultimate liability when a low percentage of ultimate losses are paid as in early periods of development, recent changes in the frequency
of workers’ compensation claims have caused the Company to place greater reliance in paid methods with continued consideration of
the state-by-state analysis and the expected loss ratio approach.
Professional Liability. Reported and paid loss developments patterns for this line tend to be volatile. Therefore, the Company typically
relies on frequency and severity techniques.
Assumed Reinsurance and All Other. For these lines, the Company tends to rely on the reported development techniques. In assumed
reinsurance, assumptions are influenced by information gained from claim and underwriting audits.
Allocated Loss Adjustment Expenses (ALAE). For some lines of business (e.g., professional liability and assumed reinsurance), ALAE
and losses are analyzed together. For most lines of business, however, ALAE is analyzed separately, using paid development
techniques and an analysis of the relationship between ALAE and loss payments.
Unallocated Loss Adjustment Expense (ULAE). ULAE is analyzed separately from loss and ALAE. For most lines of business,
incurred ULAE costs to be paid in the future are projected based on an expected cost per claim year and the anticipated claim closure
pattern and the ratio of paid ULAE to paid loss.
The final step in the reserve review process involves a comprehensive review by senior reserving actuaries who apply their judgment
and, in concert with senior management, determine the appropriate level of reserves based on the information that has been
accumulated. Numerous factors are considered in this process including, but not limited to, the assessed reliability of key loss trends
and assumptions that may be significantly influencing the current actuarial indications, pertinent trends observed over the recent past,
the level of volatility within a particular line of business, and the improvement or deterioration of actuarial indications in the current
period as compared to the prior periods. Total recorded net reserves, excluding asbestos and environmental, were 1.8% higher than the
actuarial indication of the reserves as of December 31, 2011.
See the Reserve Development section for a discussion of changes to reserve estimates recorded in 2011.
Current trends contributing to reserve uncertainty
The Hartford is a multi-line company in the property and casualty insurance business. The Hartford is therefore subject to reserve
uncertainty stemming from a number of conditions, including but not limited to those noted above, any of which could be material at
any point in time. Certain issues may become more or less important over time as conditions change. As various market conditions
develop, management must assess whether those conditions constitute a long-term trend that should result in a reserving action (i.e.,
increasing or decreasing the reserve).
Within Property & Casualty Commercial and Property & Casualty Other Operations, the Company has exposure to claims asserted for
bodily injury as a result of long-term or continuous exposure to harmful products or substances. Examples include, but are not limited
to, pharmaceutical products, silica and lead paint. The Company also has exposure to claims from construction defects, where property
damage or bodily injury from negligent construction is alleged. In addition, the Company has exposure to claims asserted against
religious institutions and other organizations relating to molestation or abuse. Such exposures may involve potentially long latency
periods and may implicate coverage in multiple policy periods. These factors make reserves for such claims more uncertain than other
bodily injury or property damage claims. With regard to these exposures, the Company is monitoring trends in litigation, the external
environment, the similarities to other mass torts and the potential impact on the Company’ s reserves.
In Consumer Markets, reserving estimates are generally less variable than for the Company’ s other property and casualty segments
because of the coverages having relatively shorter periods of loss emergence. Estimates, however, can still vary due to a number of
factors, including interpretations of frequency and severity trends and their impact on recorded reserve levels. Severity trends can be
impacted by changes in internal claim handling and case reserving practices in addition to changes in the external environment. These
changes in claim practices increase the uncertainty in the interpretation of case reserve data, which increases the uncertainty in recorded
reserve levels. In addition, the introduction of new products has led to a different mix of business by type of insured than the Company
experienced in the past. Such changes in mix increase the uncertainty of the reserve projections, since historical data and reporting
patterns may not be applicable to the new business.
In standard commercial lines, workers’ compensation is the Company’ s single biggest line of business and the line of business with the
longest pattern of loss emergence. Medical costs make up more than 50% of workers’ compensation payments. As such, reserve
estimates for workers’ compensation are particularly sensitive to changes in medical inflation, the changing use of medical care
procedures and changes in state legislative and regulatory environments. In addition, a changing economic environment can affect the
ability of an injured worker to return to work and the length of time a worker receives disability benefits. The Company has recently
experienced a sharp increase in workers’ compensation claim frequency, while only seeing a partial offset from moderating severity
trends. These factors increase the uncertainty in the estimate of reserves.