The Hartford 2011 Annual Report Download - page 119
Download and view the complete annual report
Please find page 119 of the 2011 The Hartford annual report below. You can navigate through the pages in the report by either clicking on the pages listed below, or by using the keyword search tool below to find specific information within the annual report.-
 1
1 -
2
-
3
-
4
-
5
-
6
-
7
-
8
-
9
-
10
-
11
-
12
-
13
-
14
-
15
-
16
-
17
-
18
-
19
-
20
-
21
-
22
-
23
-
24
-
25
-
26
-
27
-
28
-
29
-
30
-
31
-
32
-
33
-
34
-
35
-
36
-
37
-
38
-
39
-
40
-
41
-
42
-
43
-
44
-
45
-
46
-
47
-
48
-
49
-
50
-
51
-
52
-
53
-
54
-
55
-
56
-
57
-
58
-
59
-
60
-
61
-
62
-
63
-
64
-
65
-
66
-
67
-
68
-
69
-
70
-
71
-
72
-
73
-
74
-
75
-
76
-
77
-
78
-
79
-
80
-
81
-
82
-
83
-
84
-
85
-
86
-
87
-
88
-
89
-
90
-
91
-
92
-
93
-
94
-
95
-
96
-
97
-
98
-
99
-
100
-
101
-
102
-
103
-
104
-
105
-
106
-
107
-
108
-
 109
109 -
 110
110 -
 111
111 -
 112
112 -
 113
113 -
 114
114 -
 115
115 -
 116
116 -
 117
117 -
 118
118 -
 119
119 -
 120
120 -
 121
121 -
 122
122 -
 123
123 -
 124
124 -
 125
125 -
 126
126 -
 127
127 -
 128
128 -
 129
129 -
130
-
131
-
132
-
133
-
134
-
135
-
136
-
137
-
138
-
139
-
140
-
141
-
142
-
143
-
144
-
145
-
146
-
147
-
148
-
149
-
150
-
151
-
152
-
153
-
154
-
155
-
156
-
157
-
158
-
159
-
160
-
161
-
162
-
163
-
164
-
165
-
166
-
167
-
168
-
169
-
170
-
171
-
172
-
173
-
174
-
175
-
176
-
177
-
178
-
179
-
180
-
181
-
182
-
183
-
184
-
185
-
186
-
187
-
188
-
189
-
190
-
191
-
192
-
193
-
194
-
195
-
196
-
197
-
198
-
199
-
200
-
201
-
202
-
203
-
204
-
205
-
206
-
207
-
208
-
209
-
210
-
211
-
212
-
213
-
214
-
215
-
216
-
217
-
218
-
219
-
220
-
221
-
222
-
223
-
224
-
225
-
226
-
227
-
228
-
229
-
230
-
231
-
232
-
233
-
234
-
235
-
236
-
237
-
238
-
239
-
240
-
241
-
242
-
243
-
244
-
245
-
246
-
247
-
248
 |
 |

119
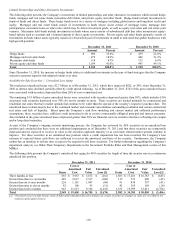
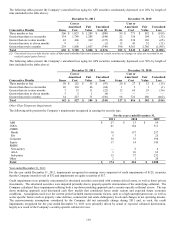
The following tables present the Company’ s unrealized loss aging for AFS securities continuously depressed over 20% by length of
time (included in the table above).
December 31, 2011 December 31, 2010
Consecutive Months
Items
Cost or
Amortized
Cost
Fair
Value
Unrealized
Loss [1]
Items
Cost or
Amortized
Cost
Fair
Value
Unrealized
Loss
Three months or less
206
$
1,823
$
1,289
$
(500)
99
$
771
$
582
$
(189)
Greater than three to six months
134
1,749
1,205
(544)
22
136
104
(32)
Greater than six to nine months
42
406
269
(137)
28
234
169
(65)
Greater than nine to eleven months
9
1
—
(1)
13
43
32
(11)
Greater than twelve months
239
1,806
1,057
(749)
390
4,361
2,766
(1,595)
Total
630
$
5,785
$
3,820
$
(1,931)
552
$
5,545
$
3,653
$
(1,892)
[1] Unrealized losses exclude the fair value of bifurcated embedded derivative features of certain securities as changes in value are recorded in net
realized capital gains (losses).
The following tables present the Company’ s unrealized loss aging for AFS securities continuously depressed over 50% by length of
time (included in the tables above).
December 31, 2011 December 31, 2010
Consecutive Months
Items
Cost or
Amortized
Cost
Fair
Value
Unrealized
Loss
Items
Cost or
Amortized
Cost
Fair
Value
Unrealized
Loss
Three months or less
50
$
152
$
55
$
(97)
20
$
27
$
12
$
(15)
Greater than three to six months
26
110
46
(64)
1
2
1
(1)
Greater than six to nine months
7
33
11
(22)
12
65
29
(36)
Greater than nine to eleven months
5
5
1
(4)
—
—
—
—
Greater than twelve months
54
227
71
(156)
94
722
260
(462)
Total
142
$
527
$
184
$
(343)
127
$
816
$
302
$
(514)
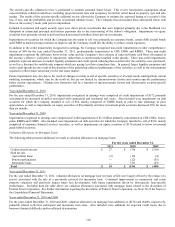
Other-Than-Temporary Impairments
The following table presents the Company’ s impairments recognized in earnings by security type.
For the years ended December 31,
2011
2010
2009
ABS
$
27
$
13
$
54
CDOs
41
164
511
CMBS
Bonds
16
157
257
IOs
5
3
25
Corporate
50
33
198
Equity
17
14
145
RMBS
Non-agency
—
2
4
Alt-A
1
10
62
Sub-prime
15
37
232
Other
2
1
20
Total
$
174
$
434
$
1,508
Year ended December 31, 2011
For the year ended December 31, 2011, impairments recognized in earnings were comprised of credit impairments of $125, securities
that the Company intends to sell of $32 and impairments on equity securities of $17.
Credit impairments were primarily concentrated in structured securities associated with commercial real estate, as well as direct private
investments. The structured securities were impaired primarily due to property-specific deterioration of the underlying collateral. The
Company calculated these impairments utilizing both a top down modeling approach and a security-specific collateral review. The top
down modeling approach used discounted cash flow models that considered losses under current and expected future economic
conditions. Assumptions used over the current period included macroeconomic factors, such as a high unemployment rate, as well as
sector specific factors such as property value declines, commercial real estate delinquency levels and changes in net operating income.
The macroeconomic assumptions considered by the Company did not materially change during 2011 and, as such, the credit
impairments recognized for the year ended December 31, 2011 were primarily driven by actual or expected collateral deterioration,
largely as a result of the Company’s security-specific collateral review.