The Hartford 2011 Annual Report Download - page 180
Download and view the complete annual report
Please find page 180 of the 2011 The Hartford annual report below. You can navigate through the pages in the report by either clicking on the pages listed below, or by using the keyword search tool below to find specific information within the annual report.-
 1
1 -
2
-
3
-
4
-
5
-
6
-
7
-
8
-
9
-
10
-
11
-
12
-
13
-
14
-
15
-
16
-
17
-
18
-
19
-
20
-
21
-
22
-
23
-
24
-
25
-
26
-
27
-
28
-
29
-
30
-
31
-
32
-
33
-
34
-
35
-
36
-
37
-
38
-
39
-
40
-
41
-
42
-
43
-
44
-
45
-
46
-
47
-
48
-
49
-
50
-
51
-
52
-
53
-
54
-
55
-
56
-
57
-
58
-
59
-
60
-
61
-
62
-
63
-
64
-
65
-
66
-
67
-
68
-
69
-
70
-
71
-
72
-
73
-
74
-
75
-
76
-
77
-
78
-
79
-
80
-
81
-
82
-
83
-
84
-
85
-
86
-
87
-
88
-
89
-
90
-
91
-
92
-
93
-
94
-
95
-
96
-
97
-
98
-
99
-
100
-
101
-
102
-
103
-
104
-
105
-
106
-
107
-
108
-
109
-
110
-
111
-
112
-
113
-
114
-
115
-
116
-
117
-
118
-
119
-
120
-
121
-
122
-
123
-
124
-
125
-
126
-
127
-
128
-
129
-
130
-
131
-
132
-
133
-
134
-
135
-
136
-
137
-
138
-
139
-
140
-
141
-
142
-
143
-
144
-
145
-
146
-
147
-
148
-
149
-
150
-
151
-
152
-
153
-
154
-
155
-
156
-
157
-
158
-
159
-
160
-
161
-
162
-
163
-
164
-
165
-
166
-
167
-
168
-
169
-
 170
170 -
 171
171 -
 172
172 -
 173
173 -
 174
174 -
 175
175 -
 176
176 -
 177
177 -
 178
178 -
 179
179 -
 180
180 -
 181
181 -
 182
182 -
 183
183 -
 184
184 -
 185
185 -
 186
186 -
 187
187 -
 188
188 -
 189
189 -
 190
190 -
191
-
192
-
193
-
194
-
195
-
196
-
197
-
198
-
199
-
200
-
201
-
202
-
203
-
204
-
205
-
206
-
207
-
208
-
209
-
210
-
211
-
212
-
213
-
214
-
215
-
216
-
217
-
218
-
219
-
220
-
221
-
222
-
223
-
224
-
225
-
226
-
227
-
228
-
229
-
230
-
231
-
232
-
233
-
234
-
235
-
236
-
237
-
238
-
239
-
240
-
241
-
242
-
243
-
244
-
245
-
246
-
247
-
248
 |
 |

THE HARTFORD FINANCIAL SERVICES GROUP, INC.
NOTES TO CONSOLIDATED FINANCIAL STATEMENTS (continued)
F-45
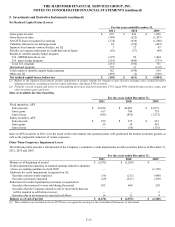
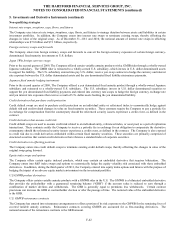
5. Investments and Derivative Instruments (continued)
Change in Notional Amount
The net increase in notional amount of derivatives since December 31, 2010, was primarily due to the following:
• During 2011, the Company significantly strengthened its hedge protection of variable annuity products offered in Japan. As such,
the notional amount related to the international program hedging instruments increased by $18.9 billion as the Company entered
into additional foreign currency denominated interest rate swaps and swaptions, currency forwards, currency options and equity
futures.
• The decrease of $8.7 billion in the combined GMWB hedging program, which includes the GMWB product, reinsurance, and
hedging derivatives, was primarily a result of policyholder lapses and withdrawals.
• The U.S. macro hedge program notional decreased $6.2 billion primarily due to the expiration of certain out of the money options in
January of 2011.
Change in Fair Value
The improvement in the total fair value of derivative instruments since December 31, 2010, was primarily related to the following:
• The fair value related to the international program hedging instruments increased as a result of the additional notional added during
the year, as well as strengthening of the Japanese yen, lower global equity markets, and a decrease in interest rates.
• The decrease in the combined GMWB hedging program, which includes the GMWB product, reinsurance, and hedging derivatives,
was primarily a result of a general decrease in long-term interest rates and higher interest rate volatility.
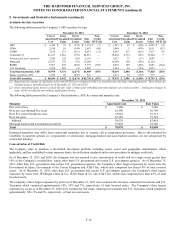
Cash Flow Hedges
For derivative instruments that are designated and qualify as cash flow hedges, the effective portion of the gain or loss on the derivative
is reported as a component of OCI and reclassified into earnings in the same period or periods during which the hedged transaction
affects earnings. Gains and losses on the derivative representing hedge ineffectiveness are recognized in current period earnings. All
components of each derivative’ s gain or loss were included in the assessment of hedge effectiveness.
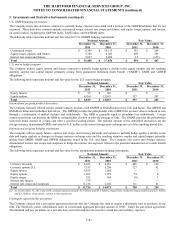
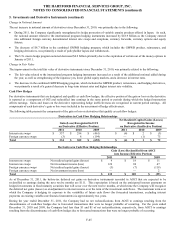
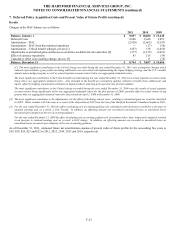
The following table presents the components of the gain or loss on derivatives that qualify as cash flow hedges:
Derivatives in Cash Flow Hedging Relationships
Gain (Loss) Recognized in OCI
on Derivative (Effective Portion)
Net Realized Capital Gains (Losses)
Recognized in Income
on Derivative (Ineffective Portion)
2011
2010
2009
2011
2010
2009
Interest rate swaps
$
337
$
294
$
(461)
$
(4)
$
2
$
(3)
Foreign currency swaps
(3)
8
(194)
—
(1)
75
Total
$
334
$
302
$
(655)
$
(4)
$
1
$
72
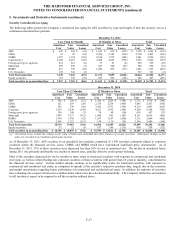
Derivatives in Cash Flow Hedging Relationships
Gain (Loss) Reclassified from AOCI
into Income (Effective Portion)
2011
2010
2009
Interest rate swaps
Net realized capital gains (losses)
$
9
$
18
$
11
Interest rate swaps
Net investment income (loss)
126
94
47
Foreign currency swaps
Net realized capital gains (losses)
(3)
(7)
(119)
Foreign currency swaps
Net investment income (loss)
—
—
2
Total
$
132
$
105
$
(59)
As of December 31, 2011, the before-tax deferred net gains on derivative instruments recorded in AOCI that are expected to be
reclassified to earnings during the next twelve months are $111. This expectation is based on the anticipated interest payments on
hedged investments in fixed maturity securities that will occur over the next twelve months, at which time the Company will recognize
the deferred net gains (losses) as an adjustment to interest income over the term of the investment cash flows. The maximum term over
which the Company is hedging its exposure to the variability of future cash flows (for forecasted transactions, excluding interest
payments on existing variable-rate financial instruments) is approximately two years.
During the year ended December 31, 2011, the Company had no net reclassifications from AOCI to earnings resulting from the
discontinuance of cash-flow hedges due to forecasted transactions that were no longer probable of occurring. For the years ended
December 31, 2010 and 2009, the Company had less than $1 and $1 of net reclassifications, respectively, from AOCI to earnings
resulting from the discontinuance of cash-flow hedges due to forecasted transactions that were no longer probable of occurring.