The Hartford 2011 Annual Report Download - page 127
Download and view the complete annual report
Please find page 127 of the 2011 The Hartford annual report below. You can navigate through the pages in the report by either clicking on the pages listed below, or by using the keyword search tool below to find specific information within the annual report.-
 1
1 -
2
-
3
-
4
-
5
-
6
-
7
-
8
-
9
-
10
-
11
-
12
-
13
-
14
-
15
-
16
-
17
-
18
-
19
-
20
-
21
-
22
-
23
-
24
-
25
-
26
-
27
-
28
-
29
-
30
-
31
-
32
-
33
-
34
-
35
-
36
-
37
-
38
-
39
-
40
-
41
-
42
-
43
-
44
-
45
-
46
-
47
-
48
-
49
-
50
-
51
-
52
-
53
-
54
-
55
-
56
-
57
-
58
-
59
-
60
-
61
-
62
-
63
-
64
-
65
-
66
-
67
-
68
-
69
-
70
-
71
-
72
-
73
-
74
-
75
-
76
-
77
-
78
-
79
-
80
-
81
-
82
-
83
-
84
-
85
-
86
-
87
-
88
-
89
-
90
-
91
-
92
-
93
-
94
-
95
-
96
-
97
-
98
-
99
-
100
-
101
-
102
-
103
-
104
-
105
-
106
-
107
-
108
-
109
-
110
-
111
-
112
-
113
-
114
-
115
-
116
-
 117
117 -
 118
118 -
 119
119 -
 120
120 -
 121
121 -
 122
122 -
 123
123 -
 124
124 -
 125
125 -
 126
126 -
 127
127 -
 128
128 -
 129
129 -
 130
130 -
 131
131 -
 132
132 -
 133
133 -
 134
134 -
 135
135 -
 136
136 -
 137
137 -
138
-
139
-
140
-
141
-
142
-
143
-
144
-
145
-
146
-
147
-
148
-
149
-
150
-
151
-
152
-
153
-
154
-
155
-
156
-
157
-
158
-
159
-
160
-
161
-
162
-
163
-
164
-
165
-
166
-
167
-
168
-
169
-
170
-
171
-
172
-
173
-
174
-
175
-
176
-
177
-
178
-
179
-
180
-
181
-
182
-
183
-
184
-
185
-
186
-
187
-
188
-
189
-
190
-
191
-
192
-
193
-
194
-
195
-
196
-
197
-
198
-
199
-
200
-
201
-
202
-
203
-
204
-
205
-
206
-
207
-
208
-
209
-
210
-
211
-
212
-
213
-
214
-
215
-
216
-
217
-
218
-
219
-
220
-
221
-
222
-
223
-
224
-
225
-
226
-
227
-
228
-
229
-
230
-
231
-
232
-
233
-
234
-
235
-
236
-
237
-
238
-
239
-
240
-
241
-
242
-
243
-
244
-
245
-
246
-
247
-
248
 |
 |

127
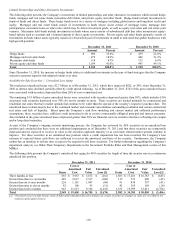
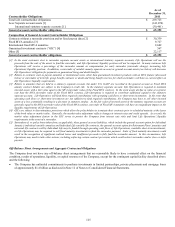
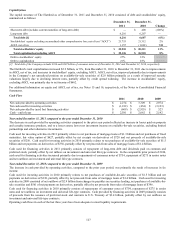
Capitalization
The capital structure of The Hartford as of December 31, 2011 and December 31, 2010 consisted of debt and stockholders’ equity,
summarized as follows:
December 31, December 31,
2011
2010
Change
Short-term debt (includes current maturities of long-term debt)
$
—
$
400
(100%)
Long-term debt
6,216
6,207
—
Total debt [1]
6,216
6,607
(6%)
Stockholders’ equity excluding accumulated other comprehensive loss, net of tax (“AOCI”)
21,753
21,312
2%
AOCI, net of tax 1,157 (1,001) NM
Total stockholders' equity
$
22,910
$
20,311
13%
Total capitalization including AOCI
$
29,126
$
26,918
8%
Debt to stockholders’ equity
27%
33%
Debt to capitalization
21%
25%
[1] Total debt of the Company excludes $314 and $382 billion of consumer notes as of December 31, 2011 and December 31, 2010, respectively.
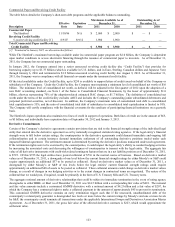
The Hartford’ s total capitalization increased $2.2 billion, or 8%, from December 31, 2010 to December 31, 2011 due to improvements
in AOCI, net of tax, and increases in stockholders’ equity, excluding AOCI. AOCI, net of tax, improved primarily due to improvements
in the Company’ s net unrealized position on available-for-sale securities of $2.0 billion primarily as a result of improved security
valuations largely due to declining interest rates, partially offset by credit spread widening. The increase in stockholders’ equity,
excluding AOCI, was primarily due to net income of $662.
For additional information on equity and AOCI, net of tax, see Notes 15 and 16, respectively, of the Notes to Consolidated Financial
Statements.
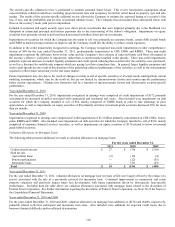
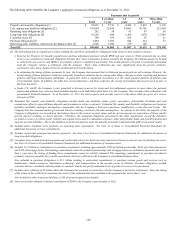
Cash Flow
2011
2010
2009
Net cash provided by operating activities
$
2,274
$
3,309
$
2,974
Net cash used for investing activities
$
(1,182)
$
(434)
$
(3,123)
Net cash provided by (used for) financing activities
$
(609)
$
(2,955)
$
523
Cash – end of year
$
2,581
$
2,062
$
2,142
Year ended December 31, 2011 compared to the year ended December 31, 2010
The decrease in cash provided by operating activities compared to the prior year period reflected an increase in losses paid on property
and casualty insurance products, and to a lesser extent, lower net investment income on available-for-sale securities, excluding limited
partnerships and other alternative investments.
Cash used for investing activities in 2011 primarily relates to net purchases of mortgage loans of $1.3 billion and net purchases of fixed
maturities, fair value option of $627, partially offset by net receipts on derivatives of $720 and net proceeds of available-for-sale
securities of $256. Cash used for investing activities in 2010 primarily relates to net purchases of available-for-sale securities of $1.5
billion and net payments on derivatives of $338, partially offset by net proceeds from sales of mortgage loans of $1.4 billion.
Cash used for financing activities in 2011 primarily consists of repayment of long-term debt and dividends paid on common and
preferred stock, partially offset by net inflows on investment and universal life-type contracts. In the comparable prior period of 2010,
cash used for financing activities increased primarily due to repayments of consumer notes of $754, repayment of $275 in senior notes
and net outflows on investment and universal life-type contracts.
Year ended December 31, 2010 compared to the year ended December 31, 2009
The increase in cash provided by operating activities, compared to the prior year period, was primarily the result of increases in fee
income.
Cash used for investing activities in 2010 primarily relates to net purchases of available-for-sale securities of $1.5 billion and net
payments on derivatives of $338, partially offset by net proceeds from sales of mortgage loans of $1.4 billion. Cash used for investing
activities in 2009 consisted of net outflows of $2.9 billion from changes in payables on securities lending, net purchases of available-for-
sale securities and $561 of net payments on derivatives, partially offset by net proceeds from sales of mortgage loans of $396.
Cash used for financing activities in 2010 primarily consists of repayments of consumer notes of $754, repayment of $275 in senior
notes and net outflows on investment and universal life-type contracts. Cash provided by financing activities in 2009 primarily consists
of proceeds from the issuance of preferred stock and warrants to U.S. Treasury of $3.4 billion, partially offset by net outflows on
investment and universal life-type contracts.
Operating cash flows in each of the last three years have been adequate to meet liquidity requirements.