The Hartford 2011 Annual Report Download - page 61
Download and view the complete annual report
Please find page 61 of the 2011 The Hartford annual report below. You can navigate through the pages in the report by either clicking on the pages listed below, or by using the keyword search tool below to find specific information within the annual report.-
 1
1 -
2
-
3
-
4
-
5
-
6
-
7
-
8
-
9
-
10
-
11
-
12
-
13
-
14
-
15
-
16
-
17
-
18
-
19
-
20
-
21
-
22
-
23
-
24
-
25
-
26
-
27
-
28
-
29
-
30
-
31
-
32
-
33
-
34
-
35
-
36
-
37
-
38
-
39
-
40
-
41
-
42
-
43
-
44
-
45
-
46
-
47
-
48
-
49
-
50
-
 51
51 -
 52
52 -
 53
53 -
 54
54 -
 55
55 -
 56
56 -
 57
57 -
 58
58 -
 59
59 -
 60
60 -
 61
61 -
 62
62 -
 63
63 -
 64
64 -
 65
65 -
 66
66 -
 67
67 -
 68
68 -
 69
69 -
 70
70 -
 71
71 -
72
-
73
-
74
-
75
-
76
-
77
-
78
-
79
-
80
-
81
-
82
-
83
-
84
-
85
-
86
-
87
-
88
-
89
-
90
-
91
-
92
-
93
-
94
-
95
-
96
-
97
-
98
-
99
-
100
-
101
-
102
-
103
-
104
-
105
-
106
-
107
-
108
-
109
-
110
-
111
-
112
-
113
-
114
-
115
-
116
-
117
-
118
-
119
-
120
-
121
-
122
-
123
-
124
-
125
-
126
-
127
-
128
-
129
-
130
-
131
-
132
-
133
-
134
-
135
-
136
-
137
-
138
-
139
-
140
-
141
-
142
-
143
-
144
-
145
-
146
-
147
-
148
-
149
-
150
-
151
-
152
-
153
-
154
-
155
-
156
-
157
-
158
-
159
-
160
-
161
-
162
-
163
-
164
-
165
-
166
-
167
-
168
-
169
-
170
-
171
-
172
-
173
-
174
-
175
-
176
-
177
-
178
-
179
-
180
-
181
-
182
-
183
-
184
-
185
-
186
-
187
-
188
-
189
-
190
-
191
-
192
-
193
-
194
-
195
-
196
-
197
-
198
-
199
-
200
-
201
-
202
-
203
-
204
-
205
-
206
-
207
-
208
-
209
-
210
-
211
-
212
-
213
-
214
-
215
-
216
-
217
-
218
-
219
-
220
-
221
-
222
-
223
-
224
-
225
-
226
-
227
-
228
-
229
-
230
-
231
-
232
-
233
-
234
-
235
-
236
-
237
-
238
-
239
-
240
-
241
-
242
-
243
-
244
-
245
-
246
-
247
-
248
 |
 |

61
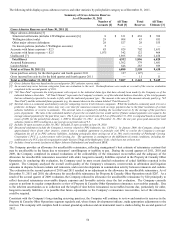
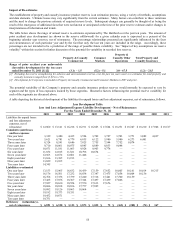
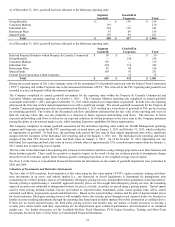
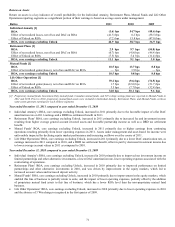
As of December 31, 2011, goodwill has been allocated to the following reporting units:
Segment
Goodwill
Goodwill in
Corporate
Total
Group Benefits
$
—
$
138
$
138
Consumer Markets
119
—
119
Individual Life
224
118
342
Retirement Plans
87
69
156
Mutual Funds
159
92
251
Total
$
589
$
417
$
1,006
As of December 31, 2010, goodwill has been allocated to the following reporting units:
Segment
Goodwill
Goodwill in
Corporate
Total
Hartford Financial Products within Property & Casualty Commercial
$
30
$
—
$
30
Group Benefits
—
138
138
Consumer Markets
119
—
119
Individual Life
224
118
342
Retirement Plans
87
69
156
Mutual Funds
159
92
251
Federal Trust Corporation within Corporate
—
15
15
Total
$
619
$
432
$
1,051
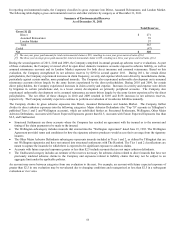
During the second quarter of 2011, the Company wrote off the remaining $15 of goodwill associated with the Federal Trust Corporation
(“FTC”) reporting unit within Corporate due to the announced divestiture of FTC. The write-off of the FTC reporting unit goodwill was
recorded as a loss on disposal within discontinued operations.
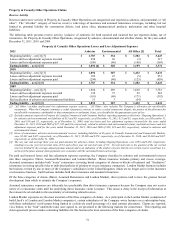
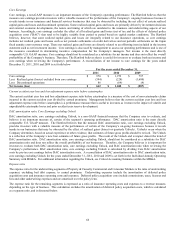
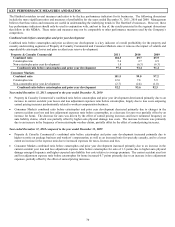
The Company completed its annual goodwill assessment for the reporting units within the Property & Casualty Commercial and
Consumer Markets operating segments on October 1, 2011. The Consumer Markets reporting unit completed its annual goodwill
assessment on October 1, 2011 and again on October 31, 2011 which resulted in no impairment of goodwill. In both tests, the reporting
unit passed the first step of their annual impairment tests with a significant margin. The annual goodwill assessment for the Property &
Casualty Commercial reporting unit that was performed on October 1, 2011 resulted in a write-down of goodwill of $30, pre-tax leaving
no remaining goodwill. The results of the discounted cash flow calculations indicated that the fair value of the reporting unit was less
than the carrying value; this was due primarily to a decrease in future expected underwriting cash flows. The decrease in future
expected underwriting cash flows is driven by an expected reduction in written premium in the short term as the Company maintains
pricing discipline in a downward market cycle, while retaining long term capabilities for future opportunities.
The Company completed its annual goodwill assessment for the individual reporting units within the Wealth Management operating
segment and Corporate, except for the FTC reporting unit, as noted above, on January 1, 2011 and October 31, 2011, which resulted in
no impairment of goodwill. In both tests, the reporting units passed the first step of their annual impairment tests with a significant
margin with the exception of the Individual Life reporting unit at the January 1, 2011 test. The Individual Life reporting unit had a
margin of less than 10% between fair value and book value on January 1, 2011. As of the October 31, 2011 impairment test, the
Individual Life reporting unit had a fair value in excess of book value of approximately 15%, a modest improvement from the January 1,
2011 results due to improving cost of capital.
The fair value of the Individual Life reporting unit is based on discounted cash flows using earnings projections on in force business and
future business growth. There could be a positive or negative impact on the result of step one in future periods if assumptions change
about the level of economic capital, future business growth, earnings projections or the weighted average cost of capital.
See Note 8 of the Notes to Consolidated Financial Statements for information on the results of goodwill impairment tests performed in
2010 and 2009.
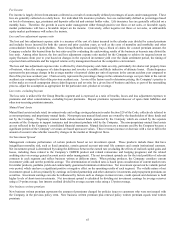
Valuation of Investments and Derivative Instruments
The fair value of AFS securities, fixed maturities, at fair value using the fair value option (“FVO”), equity securities, trading, and short-
term investments in an active and orderly market (i.e., not distressed or forced liquidation) is determined by management after
considering one of three primary sources of information: third-party pricing services, independent broker quotations or pricing matrices.
Security pricing is applied using a “waterfall” approach whereby prices are first sought from third-party pricing services, the remaining
unpriced securities are submitted to independent brokers for prices, or lastly, securities are priced using a pricing matrix. Typical inputs
used by these pricing methods include, but are not limited to, reported trades, benchmark yields, issuer spreads, bids, offers, and/or
estimated cash flows, prepayments speeds and default rates. Based on the typical trading volumes and the lack of quoted market prices
for fixed maturities, third-party pricing services will normally derive the security prices through recent reported trades for identical or
similar securities making adjustments through the reporting date based upon available market observable information as outlined above.
If there are no recent reported trades, the third party pricing services and brokers may use matrix or model processes to develop a
security price where future cash flow expectations are developed based upon collateral performance and discounted at an estimated
market rate. For further discussion, see the Available-for-Sale, Fixed Maturities, FVO, Equity Securities, Trading, and Short-Term
Investments Section in Note 4 of the Notes to Consolidated Financial Statements.