The Hartford 2011 Annual Report Download - page 182
Download and view the complete annual report
Please find page 182 of the 2011 The Hartford annual report below. You can navigate through the pages in the report by either clicking on the pages listed below, or by using the keyword search tool below to find specific information within the annual report.-
 1
1 -
2
-
3
-
4
-
5
-
6
-
7
-
8
-
9
-
10
-
11
-
12
-
13
-
14
-
15
-
16
-
17
-
18
-
19
-
20
-
21
-
22
-
23
-
24
-
25
-
26
-
27
-
28
-
29
-
30
-
31
-
32
-
33
-
34
-
35
-
36
-
37
-
38
-
39
-
40
-
41
-
42
-
43
-
44
-
45
-
46
-
47
-
48
-
49
-
50
-
51
-
52
-
53
-
54
-
55
-
56
-
57
-
58
-
59
-
60
-
61
-
62
-
63
-
64
-
65
-
66
-
67
-
68
-
69
-
70
-
71
-
72
-
73
-
74
-
75
-
76
-
77
-
78
-
79
-
80
-
81
-
82
-
83
-
84
-
85
-
86
-
87
-
88
-
89
-
90
-
91
-
92
-
93
-
94
-
95
-
96
-
97
-
98
-
99
-
100
-
101
-
102
-
103
-
104
-
105
-
106
-
107
-
108
-
109
-
110
-
111
-
112
-
113
-
114
-
115
-
116
-
117
-
118
-
119
-
120
-
121
-
122
-
123
-
124
-
125
-
126
-
127
-
128
-
129
-
130
-
131
-
132
-
133
-
134
-
135
-
136
-
137
-
138
-
139
-
140
-
141
-
142
-
143
-
144
-
145
-
146
-
147
-
148
-
149
-
150
-
151
-
152
-
153
-
154
-
155
-
156
-
157
-
158
-
159
-
160
-
161
-
162
-
163
-
164
-
165
-
166
-
167
-
168
-
169
-
170
-
171
-
 172
172 -
 173
173 -
 174
174 -
 175
175 -
 176
176 -
 177
177 -
 178
178 -
 179
179 -
 180
180 -
 181
181 -
 182
182 -
 183
183 -
 184
184 -
 185
185 -
 186
186 -
 187
187 -
 188
188 -
 189
189 -
 190
190 -
 191
191 -
 192
192 -
193
-
194
-
195
-
196
-
197
-
198
-
199
-
200
-
201
-
202
-
203
-
204
-
205
-
206
-
207
-
208
-
209
-
210
-
211
-
212
-
213
-
214
-
215
-
216
-
217
-
218
-
219
-
220
-
221
-
222
-
223
-
224
-
225
-
226
-
227
-
228
-
229
-
230
-
231
-
232
-
233
-
234
-
235
-
236
-
237
-
238
-
239
-
240
-
241
-
242
-
243
-
244
-
245
-
246
-
247
-
248
 |
 |
THE HARTFORD FINANCIAL SERVICES GROUP, INC.
NOTES TO CONSOLIDATED FINANCIAL STATEMENTS (continued)
F-47
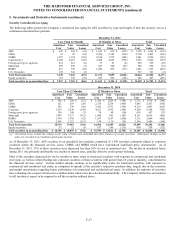
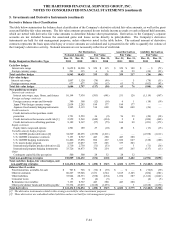
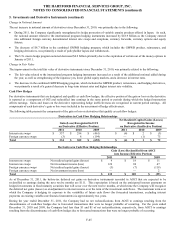
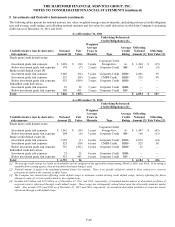
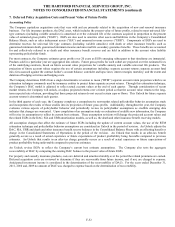
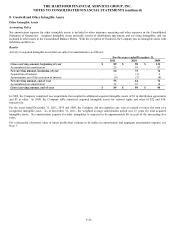
5. Investments and Derivative Instruments (continued)
For the year ended December 31, 2011, the net realized capital gain (loss) related to derivatives used in non-qualifying strategies was
primarily comprised of the following:
• The net gain associated with the international program hedging instruments was primarily driven by strengthening of the Japanese
yen, lower global equity markets, and a decrease in interest rates.
• The loss related to the combined GMWB hedging program, which includes the GMWB product, reinsurance, and hedging
derivatives, was primarily a result of a general decrease in long-term interest rates and higher interest rate volatility.
• The net loss on the U.S. macro hedge program was primarily driven by time decay and a decrease in equity market volatility since
the purchase date of certain options during the fourth quarter.
• The loss on credit derivatives that assume credit risk as a part of replication transactions resulted from credit spread widening.
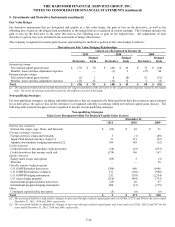
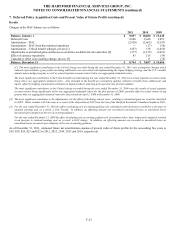
For the year ended December 31, 2010, the net realized capital gain (loss) related to derivatives used in non-qualifying strategies was
primarily comprised of the following:
• The net loss associated with the U.S. macro hedge program was primarily due to a higher equity market valuation, time decay, and
lower implied market volatility.
• The net gain on the Japanese fixed annuity hedging instruments was primarily due to the strengthening of the Japanese yen in
comparison to the U.S. dollar.
• The net gain related to the Japan 3Win foreign currency swaps was primarily due to the strengthening of the Japanese yen in
comparison to the U.S. dollar, partially offset by the decrease in long-term U.S. interest rates.
• The net gain associated with credit derivatives that assume credit risk as a part of replication transactions resulted from credit
spread tightening.
• The gain related to the combined GMWB hedging program, which includes the GMWB product, reinsurance, and hedging
derivatives, was primarily a result of liability model assumption updates during third quarter, lower implied market volatility, and
outperformance of the underlying actively managed funds as compared to their respective indices, partially offset by a general
decrease in long-term interest rates and rising equity markets.
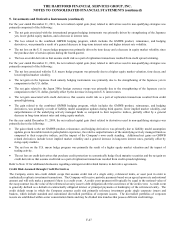
For the year ended December 31, 2009, the net realized capital gain (loss) related to derivatives used in non-qualifying strategies was
primarily due to the following:
• The gain related to the net GMWB product, reinsurance, and hedging derivatives was primarily due to liability model assumption
updates given favorable trends in policyholder experience, the relative outperformance of the underlying actively managed funds as
compared to their respective indices, and the impact of the Company’ s own credit standing. Additional net gains on GMWB
related derivatives include lower implied market volatility and a general increase in long-term interest rates, partially offset by
rising equity markets.
• The net loss on the U.S. macro hedge program was primarily the result of a higher equity market valuation and the impact of
trading activity.
• The net loss on credit derivatives that purchase credit protection to economically hedge fixed maturity securities and the net gain on
credit derivatives that assume credit risk as a part of replication transactions resulted from credit spreads tightening.
Refer to Note 12 for additional disclosures regarding contingent credit related features in derivative agreements.
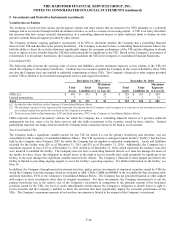
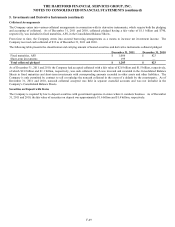
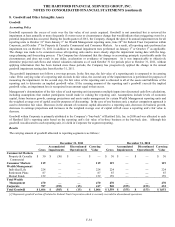
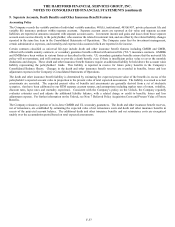
Credit Risk Assumed through Credit Derivatives
The Company enters into credit default swaps that assume credit risk of a single entity, referenced index, or asset pool in order to
synthetically replicate investment transactions. The Company will receive periodic payments based on an agreed upon rate and notional
amount and will only make a payment if there is a credit event. A credit event payment will typically be equal to the notional value of
the swap contract less the value of the referenced security issuer’ s debt obligation after the occurrence of the credit event. A credit event
is generally defined as a default on contractually obligated interest or principal payments or bankruptcy of the referenced entity. The
credit default swaps in which the Company assumes credit risk primarily reference investment grade single corporate issuers and
baskets, which include standard and customized diversified portfolios of corporate issuers. The diversified portfolios of corporate
issuers are established within sector concentration limits and may be divided into tranches that possess different credit ratings.