The Hartford 2011 Annual Report Download - page 79
Download and view the complete annual report
Please find page 79 of the 2011 The Hartford annual report below. You can navigate through the pages in the report by either clicking on the pages listed below, or by using the keyword search tool below to find specific information within the annual report.-
 1
1 -
2
-
3
-
4
-
5
-
6
-
7
-
8
-
9
-
10
-
11
-
12
-
13
-
14
-
15
-
16
-
17
-
18
-
19
-
20
-
21
-
22
-
23
-
24
-
25
-
26
-
27
-
28
-
29
-
30
-
31
-
32
-
33
-
34
-
35
-
36
-
37
-
38
-
39
-
40
-
41
-
42
-
43
-
44
-
45
-
46
-
47
-
48
-
49
-
50
-
51
-
52
-
53
-
54
-
55
-
56
-
57
-
58
-
59
-
60
-
61
-
62
-
63
-
64
-
65
-
66
-
67
-
68
-
 69
69 -
 70
70 -
 71
71 -
 72
72 -
 73
73 -
 74
74 -
 75
75 -
 76
76 -
 77
77 -
 78
78 -
 79
79 -
 80
80 -
 81
81 -
 82
82 -
 83
83 -
 84
84 -
 85
85 -
 86
86 -
 87
87 -
 88
88 -
 89
89 -
90
-
91
-
92
-
93
-
94
-
95
-
96
-
97
-
98
-
99
-
100
-
101
-
102
-
103
-
104
-
105
-
106
-
107
-
108
-
109
-
110
-
111
-
112
-
113
-
114
-
115
-
116
-
117
-
118
-
119
-
120
-
121
-
122
-
123
-
124
-
125
-
126
-
127
-
128
-
129
-
130
-
131
-
132
-
133
-
134
-
135
-
136
-
137
-
138
-
139
-
140
-
141
-
142
-
143
-
144
-
145
-
146
-
147
-
148
-
149
-
150
-
151
-
152
-
153
-
154
-
155
-
156
-
157
-
158
-
159
-
160
-
161
-
162
-
163
-
164
-
165
-
166
-
167
-
168
-
169
-
170
-
171
-
172
-
173
-
174
-
175
-
176
-
177
-
178
-
179
-
180
-
181
-
182
-
183
-
184
-
185
-
186
-
187
-
188
-
189
-
190
-
191
-
192
-
193
-
194
-
195
-
196
-
197
-
198
-
199
-
200
-
201
-
202
-
203
-
204
-
205
-
206
-
207
-
208
-
209
-
210
-
211
-
212
-
213
-
214
-
215
-
216
-
217
-
218
-
219
-
220
-
221
-
222
-
223
-
224
-
225
-
226
-
227
-
228
-
229
-
230
-
231
-
232
-
233
-
234
-
235
-
236
-
237
-
238
-
239
-
240
-
241
-
242
-
243
-
244
-
245
-
246
-
247
-
248
 |
 |

79
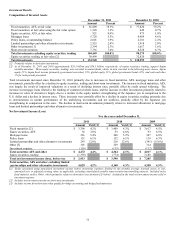
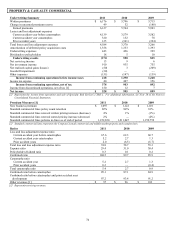
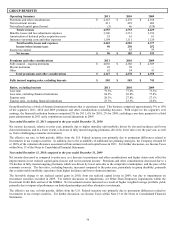
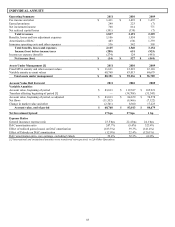
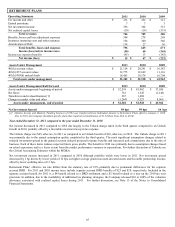
GROUP BENEFITS
Operating Summary
2011
2010
2009
Premiums and other considerations
$
4,147
$
4,278
$
4,350
Net investment income
411
429
403
Net realized capital gains (losses)
(3)
46
(124)
Total revenues
4,555
4,753
4,629
Benefits, losses and loss adjustment expenses
3,306
3,331
3,196
Amortization of deferred policy acquisition costs
55
61
61
Insurance operating costs and other expenses
1,104
1,111
1,120
Total benefits, losses and expenses
4,465
4,503
4,377
Income before income taxes
90
250
252
Income tax expense
—
65
59
Net income
$
90
$
185
$
193
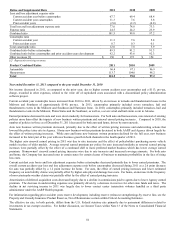
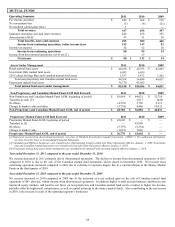
Premiums and other considerations
2011
2010
2009
Fully insured – ongoing premiums
$
4,036
$
4,166
$
4,309
Buyout premiums
49
58
—
Other
62
54
41
Total premiums and other considerations
$
4,147
$
4,278
$
4,350
Fully insured ongoing sales, excluding buyouts
$
505
$
583
$
741
Ratios, excluding buyouts
2011
2010
2009
Loss ratio
79.5%
77.6%
73.5%
Loss ratio, excluding financial institutions
84.5%
82.8%
77.8%
Expense ratio
28.3%
27.8%
27.1%
Expense ratio, excluding financial institutions
23.7%
23.3%
22.6%
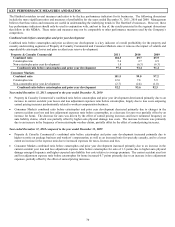
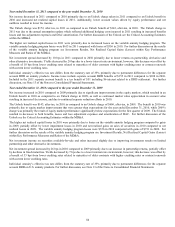
Group Benefits has a block of financial institution business that is experience rated. This business comprised approximately 9% to 10%
of the segment’ s 2011, 2010 and 2009 premiums and other considerations (excluding buyouts). With respect to the segment’ s core
earnings, the financial institution business comprised 2% for 2011, 6% for 2010, 2% for 2009, excluding a one-time payment to a third
party administrator in 2011 and a commission accrual adjustment in 2009.
Year ended December 31, 2011 compared to the year ended December 31, 2010
Net income decreased, relative to prior year, primarily due to higher mortality and morbidity driven by elevated incidence and lower
claim terminations, and to a lesser extent, a decrease in fully insured ongoing premiums, driven by lower sales over the past year, as well
as, from a challenging economic environment.
The effective tax rate, in both periods, differs from the U.S. Federal statutory rate primarily due to permanent differences related to
investments in tax exempt securities. In addition, due to the availability of additional tax planning strategies, the Company released $5
or 100% of the valuation allowance associated with investment realized capital losses in 2011. For further discussion, see Income Taxes
within Note 13 of the Notes to Consolidated Financial Statements.
Year ended December 31, 2010 compared to the year ended December 31, 2009
Net income decreased as compared to prior year, as a decrease in premiums and other considerations and higher claim costs offset the
improvements in net realized capital gains (losses) and net investment income. Premiums and other considerations decreased due to a
3% decline in fully insured ongoing premiums which was driven by lower sales due to the competitive marketplace, and the pace of the
economic recovery. The loss ratio, excluding buyouts, increased compared to the prior year, particularly in group disability, primarily
due to unfavorable morbidity experience from higher incidence and lower claim terminations.
The favorable change to net realized capital gains in 2010, from net realized capital losses in 2009, was due to impairments on
investment securities recorded in 2009. For further discussion on impairments, see Other-Than-Temporary Impairments within the
Investment Credit Risk section of the MD&A. Net investment income increased as a result of higher weighted average portfolio yields
primarily due to improved performance on limited partnerships and other alternative investments.
The effective tax rate, in both periods, differs from the U.S. Federal statutory rate primarily due to permanent differences related to
investments in tax exempt securities. For further discussion, see Income Taxes within Note 13 of the Notes to Consolidated Financial
Statements.