The Hartford 2011 Annual Report Download - page 118
Download and view the complete annual report
Please find page 118 of the 2011 The Hartford annual report below. You can navigate through the pages in the report by either clicking on the pages listed below, or by using the keyword search tool below to find specific information within the annual report.-
 1
1 -
2
-
3
-
4
-
5
-
6
-
7
-
8
-
9
-
10
-
11
-
12
-
13
-
14
-
15
-
16
-
17
-
18
-
19
-
20
-
21
-
22
-
23
-
24
-
25
-
26
-
27
-
28
-
29
-
30
-
31
-
32
-
33
-
34
-
35
-
36
-
37
-
38
-
39
-
40
-
41
-
42
-
43
-
44
-
45
-
46
-
47
-
48
-
49
-
50
-
51
-
52
-
53
-
54
-
55
-
56
-
57
-
58
-
59
-
60
-
61
-
62
-
63
-
64
-
65
-
66
-
67
-
68
-
69
-
70
-
71
-
72
-
73
-
74
-
75
-
76
-
77
-
78
-
79
-
80
-
81
-
82
-
83
-
84
-
85
-
86
-
87
-
88
-
89
-
90
-
91
-
92
-
93
-
94
-
95
-
96
-
97
-
98
-
99
-
100
-
101
-
102
-
103
-
104
-
105
-
106
-
107
-
 108
108 -
 109
109 -
 110
110 -
 111
111 -
 112
112 -
 113
113 -
 114
114 -
 115
115 -
 116
116 -
 117
117 -
 118
118 -
 119
119 -
 120
120 -
 121
121 -
 122
122 -
 123
123 -
 124
124 -
 125
125 -
 126
126 -
 127
127 -
 128
128 -
129
-
130
-
131
-
132
-
133
-
134
-
135
-
136
-
137
-
138
-
139
-
140
-
141
-
142
-
143
-
144
-
145
-
146
-
147
-
148
-
149
-
150
-
151
-
152
-
153
-
154
-
155
-
156
-
157
-
158
-
159
-
160
-
161
-
162
-
163
-
164
-
165
-
166
-
167
-
168
-
169
-
170
-
171
-
172
-
173
-
174
-
175
-
176
-
177
-
178
-
179
-
180
-
181
-
182
-
183
-
184
-
185
-
186
-
187
-
188
-
189
-
190
-
191
-
192
-
193
-
194
-
195
-
196
-
197
-
198
-
199
-
200
-
201
-
202
-
203
-
204
-
205
-
206
-
207
-
208
-
209
-
210
-
211
-
212
-
213
-
214
-
215
-
216
-
217
-
218
-
219
-
220
-
221
-
222
-
223
-
224
-
225
-
226
-
227
-
228
-
229
-
230
-
231
-
232
-
233
-
234
-
235
-
236
-
237
-
238
-
239
-
240
-
241
-
242
-
243
-
244
-
245
-
246
-
247
-
248
 |
 |

118
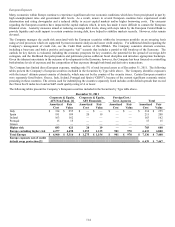
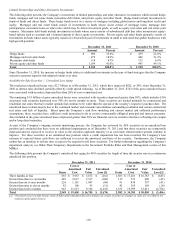
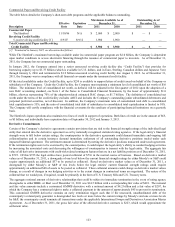
Limited Partnerships and Other Alternative Investments
The following table presents the Company’ s investments in limited partnerships and other alternative investments which include hedge
funds, mortgage and real estate funds, mezzanine debt funds, and private equity and other funds. Hedge funds include investments in
funds of funds and direct funds. These hedge funds invest in a variety of strategies including global macro and long/short credit and
equity. Mortgage and real estate funds consist of investments in funds whose assets consist of mortgage loans, mortgage loan
participations, mezzanine loans or other notes which may be below investment grade, as well as equity real estate and real estate joint
ventures. Mezzanine debt funds include investments in funds whose assets consist of subordinated debt that often incorporates equity-
based options such as warrants and a limited amount of direct equity investments. Private equity and other funds primarily consist of
investments in funds whose assets typically consist of a diversified pool of investments in small to mid-sized non-public businesses with
high growth potential.
December 31, 2011
December 31, 2010
Amount
Percent
Amount
Percent
Hedge funds
$
896
35.4%
$
439
22.8%
Mortgage and real estate funds
479
18.9%
406
21.2%
Mezzanine debt funds
118
4.7%
132
6.9%
Private equity and other funds
1,039
41.0%
941
49.1%
Total
$
2,532
100.0%
$
1,918
100.0%
Since December 31, 2010, the increase in hedge funds relates to additional investments in the type of fund strategies that the Company
expects to generate superior risk-adjusted returns over time.
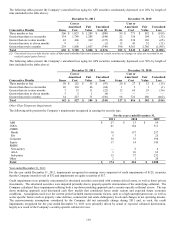
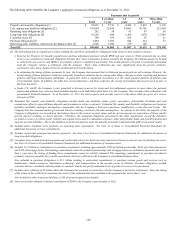
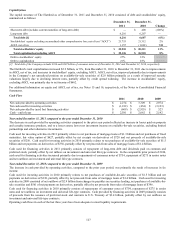
Available-for-Sale Securities — Unrealized Loss Aging
The total gross unrealized losses were $2.7 billion as of December 31, 2011, which have improved $822, or 24%, from December 31,
2010 as interest rates declined, partially offset by credit spread widening. As of December 31, 2011, $743 of the gross unrealized losses
were associated with securities depressed less than 20% of cost or amortized cost.
The remaining $1.9 billion of gross unrealized losses were associated with securities depressed greater than 20%, which includes $156
associated with securities depressed over 50% for twelve months or more. These securities are backed primarily by commercial and
residential real estate that have market spreads that continue to be wider than the spreads at the security’ s respective purchase date. The
unrealized losses remain largely due to the continued market and economic uncertainties surrounding residential and certain commercial
real estate and lack of liquidity. Based upon the Company’ s cash flow modeling and current market and collateral performance
assumptions, these securities have sufficient credit protection levels to receive contractually obligated principal and interest payments.
Also included in the gross unrealized losses depressed greater than 20% are financial services securities that have a floating-rate coupon
and/or long-dated maturities.
As part of the Company’ s ongoing security monitoring process, the Company has reviewed its AFS securities in an unrealized loss
position and concluded that there were no additional impairments as of December 31, 2011 and that these securities are temporarily
depressed and are expected to recover in value as the securities approach maturity or as real estate related market spreads continue to
improve. For these securities in an unrealized loss position where a credit impairment has not been recorded, the Company’ s best
estimate of expected future cash flows are sufficient to recover the amortized cost basis of the security. Furthermore, the Company
neither has an intention to sell nor does it expect to be required to sell these securities. For further information regarding the Company’ s
impairment analysis, see Other-Than-Temporary Impairments in the Investment Portfolio Risks and Risk Management section of this
MD&A.
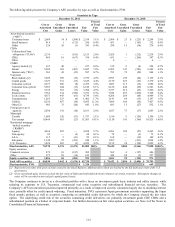
The following table presents the Company’ s unrealized loss aging for AFS securities by length of time the security was in a continuous
unrealized loss position.
December 31, 2011 December 31, 2010
Items
Cost or
Amortized
Cost
Fair
Value
Unrealized
Loss [1]
Items
Cost or
Amortized
Cost
Fair
Value
Unrealized
Loss [1]
Three months or less
855
$
3,933
$
3,672
$
(261)
1,503
$
17,431
$
16,783
$
(643)
Greater than three to six months
485
2,617
2,517
(100)
115
732
690
(42)
Greater than six to nine months
224
1,181
1,097
(84)
91
438
397
(41)
Greater than nine to eleven months
42
106
95
(11)
42
185
169
(16)
Greater than twelve months
943
11,613
9,324
(2,218)
1,231
15,599
12,811
(2,754)
Total
2,549
$
19,450
$
16,705
$
(2,674)
2,982
$
34,385
$
30,850
$
(3,496)
[1] Unrealized losses exclude the fair value of bifurcated embedded derivative features of certain securities as changes in value are recorded in net
realized capital gains (losses).