The Hartford 2011 Annual Report Download - page 170
Download and view the complete annual report
Please find page 170 of the 2011 The Hartford annual report below. You can navigate through the pages in the report by either clicking on the pages listed below, or by using the keyword search tool below to find specific information within the annual report.
THE HARTFORD FINANCIAL SERVICES GROUP, INC.
NOTES TO CONSOLIDATED FINANCIAL STATEMENTS (continued)
F-35
5. Investments and Derivative Instruments (continued)
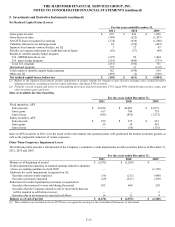
Net Realized Capital Gains (Losses)
For the years ended December 31,
2011
2010
2009
Gross gains on sales
$
693
$
836
$
1,056
Gross losses on sales
(384)
(522)
(1,397)
Net OTTI losses recognized in earnings
(174)
(434)
(1,508)
Valuation allowances on mortgage loans
24
(154)
(403)
Japanese fixed annuity contract hedges, net [1]
3
27
47
Periodic net coupon settlements on credit derivatives/Japan
(10)
(17)
(49)
Results of variable annuity hedge program
U.S. GMWB derivatives, net
(397)
89
1,464
U.S. macro hedge program
(216)
(445)
(733)
Total U.S. program
(613)
(356)
731
International program
775
11
(112)
Total results of variable annuity hedge program
162
(345)
619
Other, net [2]
(459)
(2)
(369)
Net realized capital losses, before-tax
$
(145)
$
(611)
$
(2,004)
[1] Relates to the Japanese fixed annuity product (adjustment of product liability for changes in spot currency exchange rates, related derivative
hedging instruments, excluding net period coupon settlements, and Japan FVO securities).
[2] Primarily consists of gains and losses on non-qualifying derivatives and fixed maturities, FVO, Japan 3Win related foreign currency swaps, and
other investment gains and losses.
Sales of Available-for-Sale Securities
For the years ended December 31,
2011
2010
2009
Fixed maturities, AFS
Sale proceeds
$
36,956
$
46,482
$
41,973
Gross gains
617
706
755
Gross losses
(381)
(452)
(1,272)
Equity securities, AFS
Sale proceeds
$
239
$
325
$
941
Gross gains
59
24
429
Gross losses
—
(16)
(151)
Sales of AFS securities in 2011 were the result of the reinvestment into spread product well-positioned for modest economic growth, as
well as the purposeful reduction of certain exposures.
Other-Than-Temporary Impairment Losses
The following table presents a roll-forward of the Company’ s cumulative credit impairments on debt securities held as of December 31,
2011, 2010 and 2009.
For the years ended December 31,
2011
2010
2009
Balance as of beginning of period
$
(2,072)
$
(2,200)
$
—
Credit impairments remaining in retained earnings related to adoption
of new accounting guidance in April 2009
—
—
(1,320)
Additions for credit impairments recognized on [1]:
Securities not previously impaired
(56)
(211)
(840)
Securities previously impaired
(69)
(161)
(292)
Reductions for credit impairments previously recognized on:
Securities that matured or were sold during the period
505
468
245
Securities that the Company intends to sell or more likely than not
will be required to sell before recovery — — 3
Securities due to an increase in expected cash flows
16
32
4
Balance as of end of period
$
(1,676)
$
(2,072)
$
(2,200)
[1] These additions are included in the net OTTI losses recognized in earnings in the Consolidated Statements of Operations.


