The Hartford 2011 Annual Report Download - page 169
Download and view the complete annual report
Please find page 169 of the 2011 The Hartford annual report below. You can navigate through the pages in the report by either clicking on the pages listed below, or by using the keyword search tool below to find specific information within the annual report.-
 1
1 -
2
-
3
-
4
-
5
-
6
-
7
-
8
-
9
-
10
-
11
-
12
-
13
-
14
-
15
-
16
-
17
-
18
-
19
-
20
-
21
-
22
-
23
-
24
-
25
-
26
-
27
-
28
-
29
-
30
-
31
-
32
-
33
-
34
-
35
-
36
-
37
-
38
-
39
-
40
-
41
-
42
-
43
-
44
-
45
-
46
-
47
-
48
-
49
-
50
-
51
-
52
-
53
-
54
-
55
-
56
-
57
-
58
-
59
-
60
-
61
-
62
-
63
-
64
-
65
-
66
-
67
-
68
-
69
-
70
-
71
-
72
-
73
-
74
-
75
-
76
-
77
-
78
-
79
-
80
-
81
-
82
-
83
-
84
-
85
-
86
-
87
-
88
-
89
-
90
-
91
-
92
-
93
-
94
-
95
-
96
-
97
-
98
-
99
-
100
-
101
-
102
-
103
-
104
-
105
-
106
-
107
-
108
-
109
-
110
-
111
-
112
-
113
-
114
-
115
-
116
-
117
-
118
-
119
-
120
-
121
-
122
-
123
-
124
-
125
-
126
-
127
-
128
-
129
-
130
-
131
-
132
-
133
-
134
-
135
-
136
-
137
-
138
-
139
-
140
-
141
-
142
-
143
-
144
-
145
-
146
-
147
-
148
-
149
-
150
-
151
-
152
-
153
-
154
-
155
-
156
-
157
-
158
-
 159
159 -
 160
160 -
 161
161 -
 162
162 -
 163
163 -
 164
164 -
 165
165 -
 166
166 -
 167
167 -
 168
168 -
 169
169 -
 170
170 -
 171
171 -
 172
172 -
 173
173 -
 174
174 -
 175
175 -
 176
176 -
 177
177 -
 178
178 -
 179
179 -
180
-
181
-
182
-
183
-
184
-
185
-
186
-
187
-
188
-
189
-
190
-
191
-
192
-
193
-
194
-
195
-
196
-
197
-
198
-
199
-
200
-
201
-
202
-
203
-
204
-
205
-
206
-
207
-
208
-
209
-
210
-
211
-
212
-
213
-
214
-
215
-
216
-
217
-
218
-
219
-
220
-
221
-
222
-
223
-
224
-
225
-
226
-
227
-
228
-
229
-
230
-
231
-
232
-
233
-
234
-
235
-
236
-
237
-
238
-
239
-
240
-
241
-
242
-
243
-
244
-
245
-
246
-
247
-
248
 |
 |

THE HARTFORD FINANCIAL SERVICES GROUP, INC.
NOTES TO CONSOLIDATED FINANCIAL STATEMENTS (continued)
F-34
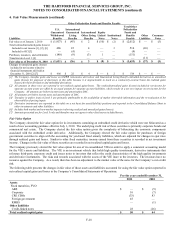
5. Investments and Derivative Instruments (continued)
Discontinuance of Hedge Accounting
The Company discontinues hedge accounting prospectively when (1) it is determined that the derivative is no longer highly effective in
offsetting changes in the fair value or cash flows of a hedged item; (2) the derivative is de-designated as a hedging instrument; or (3) the
derivative expires or is sold, terminated or exercised.
When hedge accounting is discontinued because it is determined that the derivative no longer qualifies as an effective fair-value hedge,
the derivative continues to be carried at fair value on the balance sheet with changes in its fair value recognized in current period
earnings.
When hedge accounting is discontinued because the Company becomes aware that it is not probable that the forecasted transaction will
occur, the derivative continues to be carried on the balance sheet at its fair value, and gains and losses that were accumulated in AOCI
are recognized immediately in earnings.
In other situations in which hedge accounting is discontinued on a cash-flow hedge, including those where the derivative is sold,
terminated or exercised, amounts previously deferred in AOCI are reclassified into earnings when earnings are impacted by the
variability of the cash flow of the hedged item.
Embedded Derivatives
The Company purchases and issues financial instruments and products that contain embedded derivative instruments. When it is
determined that (1) the embedded derivative possesses economic characteristics that are not clearly and closely related to the economic
characteristics of the host contract, and (2) a separate instrument with the same terms would qualify as a derivative instrument, the
embedded derivative is bifurcated from the host for measurement purposes. The embedded derivative, which is reported with the host
instrument in the consolidated balance sheets, is carried at fair value with changes in fair value reported in net realized capital gains and
losses.
Credit Risk
Credit risk is measured as the amount owed to the Company based on current market conditions and potential payment obligations
between the Company and its counterparties. For each legal entity of the Company, credit exposures are generally quantified daily
based on the prior business day’ s market value and collateral is pledged to and held by, or on behalf of, the Company to the extent the
current value of derivatives exceeds the contractual thresholds for every counterparty. For the company’ s domestic derivative programs,
the maximum uncollateralized threshold for a derivative counterparty for a single level entity is generally $10. The Company also
minimizes the credit risk of derivative instruments by entering into transactions with high quality counterparties rated A or better, which
are monitored and evaluated by the Company’ s risk management team and reviewed by senior management. In addition, the Company
monitors counterparty credit exposure on a monthly basis to ensure compliance with Company policies and statutory limitations. The
Company generally requires that derivative contracts, other than exchange traded contracts, certain forward contracts, and certain
embedded and reinsurance derivatives, be governed by an International Swaps and Derivatives Association Master Agreement which is
structured by legal entity and by counterparty and permits right of offset.
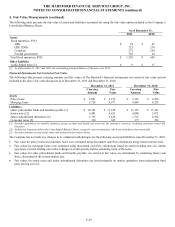
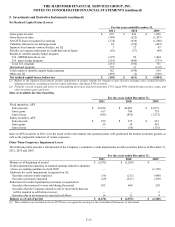
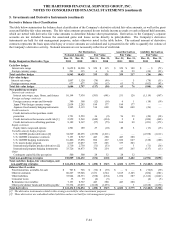
Net Investment Income (Loss)
For the years ended December 31,
(Before-tax)
2011
2010
2009
Fixed maturities
$
3,396
$
3,489
$
3,617
Equity securities, AFS
36
53
93
Mortgage loans
281
260
307
Policy loans
131
132
139
Limited partnerships and other alternative investments
243
216
(341)
Other investments
301
329
314
Investment expenses
(116)
(115)
(112)
Total securities AFS and other
4,272
4,364
4,017
Equity securities, trading
(1,359)
(774)
3,188
Total net investment income (loss)
$
2,913
$
3,590
$
7,205
The net unrealized gain (loss) on equity securities, trading, included in net investment income during the years ended December 31,
2011, 2010 and 2009, was ($1.3) billion, ($68) and $3.4 billion, respectively, substantially all of which have corresponding amounts
credited to policyholders. These amounts were not included in gross unrealized gains (losses).