The Hartford 2011 Annual Report Download - page 183
Download and view the complete annual report
Please find page 183 of the 2011 The Hartford annual report below. You can navigate through the pages in the report by either clicking on the pages listed below, or by using the keyword search tool below to find specific information within the annual report.-
 1
1 -
2
-
3
-
4
-
5
-
6
-
7
-
8
-
9
-
10
-
11
-
12
-
13
-
14
-
15
-
16
-
17
-
18
-
19
-
20
-
21
-
22
-
23
-
24
-
25
-
26
-
27
-
28
-
29
-
30
-
31
-
32
-
33
-
34
-
35
-
36
-
37
-
38
-
39
-
40
-
41
-
42
-
43
-
44
-
45
-
46
-
47
-
48
-
49
-
50
-
51
-
52
-
53
-
54
-
55
-
56
-
57
-
58
-
59
-
60
-
61
-
62
-
63
-
64
-
65
-
66
-
67
-
68
-
69
-
70
-
71
-
72
-
73
-
74
-
75
-
76
-
77
-
78
-
79
-
80
-
81
-
82
-
83
-
84
-
85
-
86
-
87
-
88
-
89
-
90
-
91
-
92
-
93
-
94
-
95
-
96
-
97
-
98
-
99
-
100
-
101
-
102
-
103
-
104
-
105
-
106
-
107
-
108
-
109
-
110
-
111
-
112
-
113
-
114
-
115
-
116
-
117
-
118
-
119
-
120
-
121
-
122
-
123
-
124
-
125
-
126
-
127
-
128
-
129
-
130
-
131
-
132
-
133
-
134
-
135
-
136
-
137
-
138
-
139
-
140
-
141
-
142
-
143
-
144
-
145
-
146
-
147
-
148
-
149
-
150
-
151
-
152
-
153
-
154
-
155
-
156
-
157
-
158
-
159
-
160
-
161
-
162
-
163
-
164
-
165
-
166
-
167
-
168
-
169
-
170
-
171
-
172
-
 173
173 -
 174
174 -
 175
175 -
 176
176 -
 177
177 -
 178
178 -
 179
179 -
 180
180 -
 181
181 -
 182
182 -
 183
183 -
 184
184 -
 185
185 -
 186
186 -
 187
187 -
 188
188 -
 189
189 -
 190
190 -
 191
191 -
 192
192 -
 193
193 -
194
-
195
-
196
-
197
-
198
-
199
-
200
-
201
-
202
-
203
-
204
-
205
-
206
-
207
-
208
-
209
-
210
-
211
-
212
-
213
-
214
-
215
-
216
-
217
-
218
-
219
-
220
-
221
-
222
-
223
-
224
-
225
-
226
-
227
-
228
-
229
-
230
-
231
-
232
-
233
-
234
-
235
-
236
-
237
-
238
-
239
-
240
-
241
-
242
-
243
-
244
-
245
-
246
-
247
-
248
 |
 |

THE HARTFORD FINANCIAL SERVICES GROUP, INC.
NOTES TO CONSOLIDATED FINANCIAL STATEMENTS (continued)
F-48
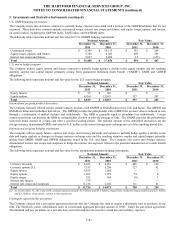
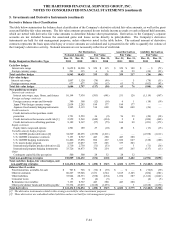
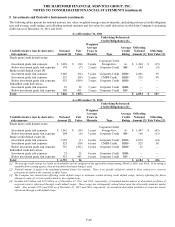
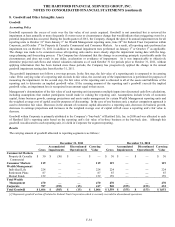
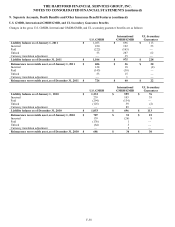
5. Investments and Derivative Instruments (continued)
The following tables present the notional amount, fair value, weighted average years to maturity, underlying referenced credit obligation
type and average credit ratings, and offsetting notional amounts and fair value for credit derivatives in which the Company is assuming
credit risk as of December 31, 2011 and 2010.
As of December 31, 2011
Underlying Referenced
Credit Obligation(s) [1]
Credit Derivative type by derivative
risk exposure
Notional
Amount [2]
Fair
Value
Weighted
Average
Years to
Maturity
Type
Average
Credit
Rating
Offsetting
Notional
Amount [3]
Offsetting
Fair Value [3]
Single name credit default swaps
Investment grade risk exposure
$
1,628
$
(34)
3 years
Corporate Credit/
Foreign Gov.
A+
$
1,424
$
(15)
Below investment grade risk exposure
170
(7)
2 years
Corporate Credit
BB-
144
(5)
Basket credit default swaps [4]
Investment grade risk exposure
3,645
(92)
3 years
Corporate Credit
BBB+
2,001
29
Investment grade risk exposure
525
(98)
5 years
CMBS Credit
BBB+
525
98
Below investment grade risk exposure
553
(509)
3 years
Corporate Credit
BBB+
—
—
Embedded credit derivatives
Investment grade risk exposure
25
24
3 years
Corporate Credit
BBB-
—
—
Below investment grade risk exposure
500
411
5 years
Corporate Credit
BB+
—
—
Total
$
7,046
$
(305)
$
4,094
$
107
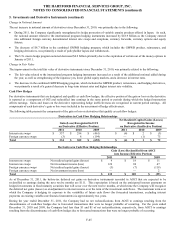
As of December 31, 2010
Underlying Referenced
Credit Obligation(s) [1]
Credit Derivative type by derivative
risk exposure
Notional
Amount [2]
Fair
Value
Weighted
Average
Years to
Maturity Type
Average
Credit
Rating
Offsetting
Notional
Amount [3]
Offsetting
Fair Value [3]
Single name credit default swaps
Investment grade risk exposure $
1,562 $
(14) 3 years
Corporate Credit/
Foreign Gov. A+ $
1,447 $
(41)
Below investment grade risk exposure
204
(6)
3 years
Corporate Credit
BB-
168
(13)
Basket credit default swaps [4]
Investment grade risk exposure
3,145
(1)
4 years
Corporate Credit
BBB+
2,019
(14)
Investment grade risk exposure
525
(50)
6 years
CMBS Credit
BBB+
525
50
Below investment grade risk exposure
767
(381)
4 years
Corporate Credit
BBB+
25
—
Embedded credit derivatives
Investment grade risk exposure
25
25
4 years
Corporate Credit
BBB-
—
—
Below investment grade risk exposure
525
463
6 years
Corporate Credit
BB+
—
—
Total
$
6,753
$
36
$
4,184
$
(18)
[1] The average credit ratings are based on availability and the midpoint of the applicable ratings among Moody’s, S&P, and Fitch. If no rating is
available from a rating agency, then an internally developed rating is used.
[2] Notional amount is equal to the maximum potential future loss amount. There is no specific collateral related to these contracts or recourse
provisions included in the contracts to offset losses.
[3] The Company has entered into offsetting credit default swaps to terminate certain existing credit default swaps, thereby offsetting the future
changes in value of, or losses paid related to, the original swap.
[4] Includes $4.2 billion and $3.9 billion as of December 31, 2011 and 2010, respectively, of standard market indices of diversified portfolios of
corporate issuers referenced through credit default swaps. These swaps are subsequently valued based upon the observable standard market
index. Also includes $553 and $542 as of December 31, 2011 and 2010, respectively, of customized diversified portfolios of corporate issuers
referenced through credit default swaps.