The Hartford 2011 Annual Report Download - page 188
Download and view the complete annual report
Please find page 188 of the 2011 The Hartford annual report below. You can navigate through the pages in the report by either clicking on the pages listed below, or by using the keyword search tool below to find specific information within the annual report.-
 1
1 -
2
-
3
-
4
-
5
-
6
-
7
-
8
-
9
-
10
-
11
-
12
-
13
-
14
-
15
-
16
-
17
-
18
-
19
-
20
-
21
-
22
-
23
-
24
-
25
-
26
-
27
-
28
-
29
-
30
-
31
-
32
-
33
-
34
-
35
-
36
-
37
-
38
-
39
-
40
-
41
-
42
-
43
-
44
-
45
-
46
-
47
-
48
-
49
-
50
-
51
-
52
-
53
-
54
-
55
-
56
-
57
-
58
-
59
-
60
-
61
-
62
-
63
-
64
-
65
-
66
-
67
-
68
-
69
-
70
-
71
-
72
-
73
-
74
-
75
-
76
-
77
-
78
-
79
-
80
-
81
-
82
-
83
-
84
-
85
-
86
-
87
-
88
-
89
-
90
-
91
-
92
-
93
-
94
-
95
-
96
-
97
-
98
-
99
-
100
-
101
-
102
-
103
-
104
-
105
-
106
-
107
-
108
-
109
-
110
-
111
-
112
-
113
-
114
-
115
-
116
-
117
-
118
-
119
-
120
-
121
-
122
-
123
-
124
-
125
-
126
-
127
-
128
-
129
-
130
-
131
-
132
-
133
-
134
-
135
-
136
-
137
-
138
-
139
-
140
-
141
-
142
-
143
-
144
-
145
-
146
-
147
-
148
-
149
-
150
-
151
-
152
-
153
-
154
-
155
-
156
-
157
-
158
-
159
-
160
-
161
-
162
-
163
-
164
-
165
-
166
-
167
-
168
-
169
-
170
-
171
-
172
-
173
-
174
-
175
-
176
-
177
-
 178
178 -
 179
179 -
 180
180 -
 181
181 -
 182
182 -
 183
183 -
 184
184 -
 185
185 -
 186
186 -
 187
187 -
 188
188 -
 189
189 -
 190
190 -
 191
191 -
 192
192 -
 193
193 -
 194
194 -
 195
195 -
 196
196 -
 197
197 -
 198
198 -
199
-
200
-
201
-
202
-
203
-
204
-
205
-
206
-
207
-
208
-
209
-
210
-
211
-
212
-
213
-
214
-
215
-
216
-
217
-
218
-
219
-
220
-
221
-
222
-
223
-
224
-
225
-
226
-
227
-
228
-
229
-
230
-
231
-
232
-
233
-
234
-
235
-
236
-
237
-
238
-
239
-
240
-
241
-
242
-
243
-
244
-
245
-
246
-
247
-
248
 |
 |

THE HARTFORD FINANCIAL SERVICES GROUP, INC.
NOTES TO CONSOLIDATED FINANCIAL STATEMENTS (continued)
F-53
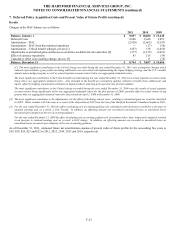
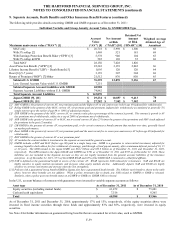
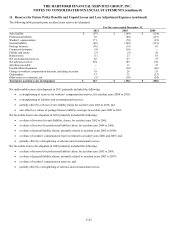
7. Deferred Policy Acquisition Costs and Present Value of Future Profits (continued)
Results
Changes in the DAC balance are as follows:
2011
2010
2009
Balance, January 1
$
9,857
$
10,686
$
13,248
Deferred Costs
2,608
2,648
2,853
Amortization – DAC
(2,920)
(2,665)
(3,247)
Amortization – DAC from discontinued operations
—
(17)
(10)
Amortization – Unlock benefit (charge), pre-tax [1]
(507)
138
(1,010)
Adjustments to unrealized gains and losses on securities available-for-sale and other [2]
(377)
(1,159)
(1,031)
Effect of currency translation
83
215
(39)
Cumulative effect of accounting change, pre-tax [3]
—
11
(78)
Balance, December 31
$
8,744
$
9,857
$
10,686
[1] The most significant contributors to the Unlock charge recorded during the year ended December 31, 2011 were assumption changes which
reduced expected future gross profits including additional costs associated with implementing the Japan hedging strategy and the U.S. variable
annuity macro hedge program, as well as actual separate account returns below our aggregated estimated return.
The most significant contributors to the Unlock benefit recorded during the year ended December 31, 2010 were actual separate account returns
being above our aggregated estimated return. Also included in the benefit are assumption updates related to benefits from withdrawals and
lapses, offset by hedging, annuitization estimates on Japan products, and long-term expected rate of return updates.
The most significant contributors to the Unlock charge recorded during the year ended December 31, 2009 were the results of actual separate
account returns being significantly below our aggregated estimated return for the first quarter of 2009, partially offset by actual returns being
greater than our aggregated estimated return for the period from April 1, 2009 to December 31, 2009.
[2] The most significant contributor to the adjustments was the effect of declining interest rates, resulting in unrealized gains on securities classified
in AOCI. Other includes a $34 decrease as a result of the disposition of DAC from the sale of the Hartford Investment Canadian Canada in 2010.
[3] For the year ended December 31, 2010 the effect of adopting new accounting guidance for embedded credit derivatives resulted in a decrease to
retained earnings and, as a result, a DAC benefit. In addition, an offsetting amount was recorded in unrealized losses as unrealized losses
decreased upon adoption of the new accounting guidance.
For the year ended December 31, 2009 the effect of adopting new accounting guidance for investments other- than- temporarily impaired resulted
in an increase to retained earnings and, as a result, a DAC charge. In addition, an offsetting amount was recorded in unrealized losses as
unrealized losses increased upon adoption of the new accounting guidance.
As of December 31, 2011, estimated future net amortization expense of present value of future profits for the succeeding five years is
$39, $58, $24, $23 and $22 in 2012, 2013, 2014, 2015 and 2016, respectively.