The Hartford 2011 Annual Report Download - page 78
Download and view the complete annual report
Please find page 78 of the 2011 The Hartford annual report below. You can navigate through the pages in the report by either clicking on the pages listed below, or by using the keyword search tool below to find specific information within the annual report.-
 1
1 -
2
-
3
-
4
-
5
-
6
-
7
-
8
-
9
-
10
-
11
-
12
-
13
-
14
-
15
-
16
-
17
-
18
-
19
-
20
-
21
-
22
-
23
-
24
-
25
-
26
-
27
-
28
-
29
-
30
-
31
-
32
-
33
-
34
-
35
-
36
-
37
-
38
-
39
-
40
-
41
-
42
-
43
-
44
-
45
-
46
-
47
-
48
-
49
-
50
-
51
-
52
-
53
-
54
-
55
-
56
-
57
-
58
-
59
-
60
-
61
-
62
-
63
-
64
-
65
-
66
-
67
-
 68
68 -
 69
69 -
 70
70 -
 71
71 -
 72
72 -
 73
73 -
 74
74 -
 75
75 -
 76
76 -
 77
77 -
 78
78 -
 79
79 -
 80
80 -
 81
81 -
 82
82 -
 83
83 -
 84
84 -
 85
85 -
 86
86 -
 87
87 -
 88
88 -
89
-
90
-
91
-
92
-
93
-
94
-
95
-
96
-
97
-
98
-
99
-
100
-
101
-
102
-
103
-
104
-
105
-
106
-
107
-
108
-
109
-
110
-
111
-
112
-
113
-
114
-
115
-
116
-
117
-
118
-
119
-
120
-
121
-
122
-
123
-
124
-
125
-
126
-
127
-
128
-
129
-
130
-
131
-
132
-
133
-
134
-
135
-
136
-
137
-
138
-
139
-
140
-
141
-
142
-
143
-
144
-
145
-
146
-
147
-
148
-
149
-
150
-
151
-
152
-
153
-
154
-
155
-
156
-
157
-
158
-
159
-
160
-
161
-
162
-
163
-
164
-
165
-
166
-
167
-
168
-
169
-
170
-
171
-
172
-
173
-
174
-
175
-
176
-
177
-
178
-
179
-
180
-
181
-
182
-
183
-
184
-
185
-
186
-
187
-
188
-
189
-
190
-
191
-
192
-
193
-
194
-
195
-
196
-
197
-
198
-
199
-
200
-
201
-
202
-
203
-
204
-
205
-
206
-
207
-
208
-
209
-
210
-
211
-
212
-
213
-
214
-
215
-
216
-
217
-
218
-
219
-
220
-
221
-
222
-
223
-
224
-
225
-
226
-
227
-
228
-
229
-
230
-
231
-
232
-
233
-
234
-
235
-
236
-
237
-
238
-
239
-
240
-
241
-
242
-
243
-
244
-
245
-
246
-
247
-
248
 |
 |
78
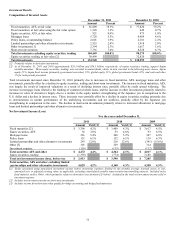
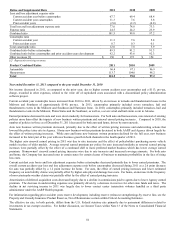
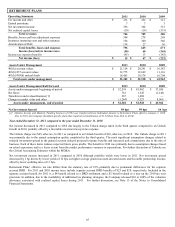
Year ended December 31, 2010 compared to the year ended December 31, 2009
Net income increased in 2010, as compared to the prior year, driven by improvements in net realized capital gains (losses) and higher
net investment income, despite a decrease in underwriting results. The primary causes of the decrease in underwriting results were
lower earned premiums and higher current accident year catastrophe losses.
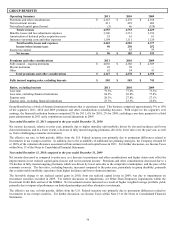
Earned premiums decreased across most product lines, with the exception of workers compensation and specialty casualty. The effects
of the economic downturn contributed to the decrease in earned premiums during 2010. Although earned premiums declined, several
key measures showed improvement. New business written premium increased, driven by increases in specialty casualty and package
business, partially offset by decreases in general liability, professional liability and marine. In addition, for standard commercial lines,
policy count retention increased in all lines of business, due in part by an improvement in mid-term cancellations in 2010. Renewal
earned pricing was flat for standard commercial lines, as an increase in package business and property was offset by a decrease in all
other lines. The earned pricing changes were primarily a reflection of written pricing changes over the last year. Renewal written
pricing increased for standard commercial lines driven by increases in property and workers compensation, partially offset by decreases
in all other lines. Lastly, the number of policies-in-force increased, primarily due to the increase in policy count retention. The growth in
policies in-force does not correspond directly with the change in earned premiums due to the effect of changes in earned pricing and
changes in the average premium per policy.
Current accident year losses and loss adjustment expenses before catastrophes decreased slightly, due to the decrease in earned
premiums, which was mostly offset by an increase in the current accident year loss and loss adjustment expense ratio before
catastrophes. The ratio increased, primarily due to higher severity on package business and workers’ compensation, as well as an
increased ratio for specialty casualty.
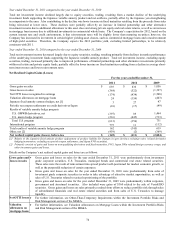
Current accident year catastrophe losses in 2010 were higher than in 2009 primarily due to more severe windstorm events, particularly
from hail in the West, Midwest, plains states and the Southeast, and from winter storms in the Mid-Atlantic and Northeast. Losses in
2009 were primarily incurred from ice storms, windstorms and tornadoes across many states.
For information regarding prior accident years reserve development, including reserve (releases) strengthenings by reserve line, see the
Property and Casualty Insurance Product Reserves, Net of Reinsurance section within Critical Accounting Estimates.
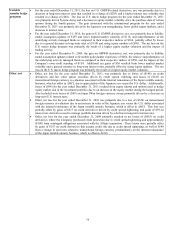
Underwriting expenses increased in 2010, driven by an increase in taxes, licenses and fees of $19, which included a $5 increase in
reserve strengthening for other state funds and taxes and a $7 reduction in TWIA assessments recognized in 2009 related to hurricane
Ike. Also contributing to the increase were higher technology costs, partially offset by lower compensation-related costs. Amortization
of deferred policy acquisition costs decreased, largely due to the decrease in earned premiums. The change in dividends to
policyholders is due to a decrease in 2010 of dividends payable primarily for workers’ compensation policyholders.
Net realized capital gains (losses) improved as compared to the prior year, as did net investment income. The improvements in net
realized capital gains (loss) were primarily driven by lower impairments in 2010 compared to 2009 and realized gains on derivatives in
2010 compared to losses in 2009. Net investment income increased in 2010, primarily as a result of improvements in limited
partnerships and other alternative investments, partially offset by lower returns on taxable fixed maturities due to declining interest rates.
For additional information, see the Investment Results section within Key Performance Measures and Ratios.
The effective tax rate, in both periods, differs from the U.S. Federal statutory rate primarily due to permanent differences related to
investments in tax exempt securities. For further discussion, see Income Taxes within Note 13 of the Notes to Consolidated Financial
Statements.