The Hartford 2011 Annual Report Download - page 86
Download and view the complete annual report
Please find page 86 of the 2011 The Hartford annual report below. You can navigate through the pages in the report by either clicking on the pages listed below, or by using the keyword search tool below to find specific information within the annual report.-
 1
1 -
2
-
3
-
4
-
5
-
6
-
7
-
8
-
9
-
10
-
11
-
12
-
13
-
14
-
15
-
16
-
17
-
18
-
19
-
20
-
21
-
22
-
23
-
24
-
25
-
26
-
27
-
28
-
29
-
30
-
31
-
32
-
33
-
34
-
35
-
36
-
37
-
38
-
39
-
40
-
41
-
42
-
43
-
44
-
45
-
46
-
47
-
48
-
49
-
50
-
51
-
52
-
53
-
54
-
55
-
56
-
57
-
58
-
59
-
60
-
61
-
62
-
63
-
64
-
65
-
66
-
67
-
68
-
69
-
70
-
71
-
72
-
73
-
74
-
75
-
 76
76 -
 77
77 -
 78
78 -
 79
79 -
 80
80 -
 81
81 -
 82
82 -
 83
83 -
 84
84 -
 85
85 -
 86
86 -
 87
87 -
 88
88 -
 89
89 -
 90
90 -
 91
91 -
 92
92 -
 93
93 -
 94
94 -
 95
95 -
 96
96 -
97
-
98
-
99
-
100
-
101
-
102
-
103
-
104
-
105
-
106
-
107
-
108
-
109
-
110
-
111
-
112
-
113
-
114
-
115
-
116
-
117
-
118
-
119
-
120
-
121
-
122
-
123
-
124
-
125
-
126
-
127
-
128
-
129
-
130
-
131
-
132
-
133
-
134
-
135
-
136
-
137
-
138
-
139
-
140
-
141
-
142
-
143
-
144
-
145
-
146
-
147
-
148
-
149
-
150
-
151
-
152
-
153
-
154
-
155
-
156
-
157
-
158
-
159
-
160
-
161
-
162
-
163
-
164
-
165
-
166
-
167
-
168
-
169
-
170
-
171
-
172
-
173
-
174
-
175
-
176
-
177
-
178
-
179
-
180
-
181
-
182
-
183
-
184
-
185
-
186
-
187
-
188
-
189
-
190
-
191
-
192
-
193
-
194
-
195
-
196
-
197
-
198
-
199
-
200
-
201
-
202
-
203
-
204
-
205
-
206
-
207
-
208
-
209
-
210
-
211
-
212
-
213
-
214
-
215
-
216
-
217
-
218
-
219
-
220
-
221
-
222
-
223
-
224
-
225
-
226
-
227
-
228
-
229
-
230
-
231
-
232
-
233
-
234
-
235
-
236
-
237
-
238
-
239
-
240
-
241
-
242
-
243
-
244
-
245
-
246
-
247
-
248
 |
 |
86
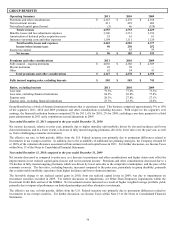
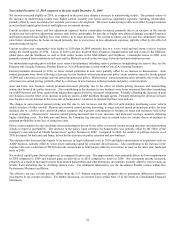
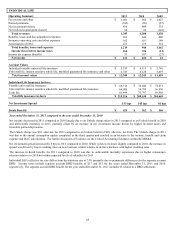
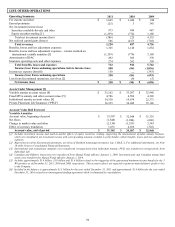
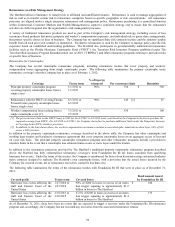
Year ended December 31, 2010 compared to the year ended December 31, 2009
Net income increased in 2010 compared to 2009 primarily due to net realized capital gains and Unlock benefit in 2010. In addition,
Individual Life’ s net income increased, excluding the improvements to net realized gains and an Unlock benefit, due to improvements in
the segment’ s individual life business.
Individual Life’ s net realized gains in 2010 compared to net realized capital losses in 2009 were primarily due to lower losses from
impairments. For further discussion on impairments, see Other-Than-Temporary Impairments within the Investment Credit Risk section
of the MD&A.
The Unlock benefit was $28, after-tax, in 2010 as compared to an Unlock charge of $51, after-tax, in 2009. The benefit in 2010 was
primarily due to assumption updates related to lapse rates, investment margin and mortality, partially offset by persistency, while 2009’ s
charge was primarily the result of assumption updates related to investment margin and expenses, as well as equity market performance
significantly below expectations in 2009, partially offset by assumption updates on lapse rates. The Unlock primarily resulted in
decreases to amortization of DAC and fee income and other. For further discussion of the Unlock see the Critical Accounting Estimates
within the MD&A.
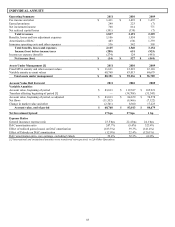
Net investment income increased primarily due to improved performance of limited partnerships and other alternative investments and
earnings on a higher average invested asset base in 2010 compared to 2009, partially offset by lower yields on fixed maturity
investments. Net investment spread increased by 64 bps in 2010 compared to 2009 driven by improved investment yields of 33 bps and
decreased crediting rates of 31 bps. The lower crediting rates related to maturities of older contracts with higher crediting rates or
contract renewals with current lower crediting rates.
Individual Life’ s effective tax rate differs from the statutory rate of 35% primarily due to permanent differences for the separate account
DRD, partially offset by a valuation allowance on deferred tax benefits related to certain realized losses in 2010. For further discussion,
see Note 13 of the Notes to Consolidated Financial Statements.