The Hartford 2011 Annual Report Download - page 103
Download and view the complete annual report
Please find page 103 of the 2011 The Hartford annual report below. You can navigate through the pages in the report by either clicking on the pages listed below, or by using the keyword search tool below to find specific information within the annual report.-
 1
1 -
2
-
3
-
4
-
5
-
6
-
7
-
8
-
9
-
10
-
11
-
12
-
13
-
14
-
15
-
16
-
17
-
18
-
19
-
20
-
21
-
22
-
23
-
24
-
25
-
26
-
27
-
28
-
29
-
30
-
31
-
32
-
33
-
34
-
35
-
36
-
37
-
38
-
39
-
40
-
41
-
42
-
43
-
44
-
45
-
46
-
47
-
48
-
49
-
50
-
51
-
52
-
53
-
54
-
55
-
56
-
57
-
58
-
59
-
60
-
61
-
62
-
63
-
64
-
65
-
66
-
67
-
68
-
69
-
70
-
71
-
72
-
73
-
74
-
75
-
76
-
77
-
78
-
79
-
80
-
81
-
82
-
83
-
84
-
85
-
86
-
87
-
88
-
89
-
90
-
91
-
92
-
 93
93 -
 94
94 -
 95
95 -
 96
96 -
 97
97 -
 98
98 -
 99
99 -
 100
100 -
 101
101 -
 102
102 -
 103
103 -
 104
104 -
 105
105 -
 106
106 -
 107
107 -
 108
108 -
 109
109 -
 110
110 -
 111
111 -
 112
112 -
 113
113 -
114
-
115
-
116
-
117
-
118
-
119
-
120
-
121
-
122
-
123
-
124
-
125
-
126
-
127
-
128
-
129
-
130
-
131
-
132
-
133
-
134
-
135
-
136
-
137
-
138
-
139
-
140
-
141
-
142
-
143
-
144
-
145
-
146
-
147
-
148
-
149
-
150
-
151
-
152
-
153
-
154
-
155
-
156
-
157
-
158
-
159
-
160
-
161
-
162
-
163
-
164
-
165
-
166
-
167
-
168
-
169
-
170
-
171
-
172
-
173
-
174
-
175
-
176
-
177
-
178
-
179
-
180
-
181
-
182
-
183
-
184
-
185
-
186
-
187
-
188
-
189
-
190
-
191
-
192
-
193
-
194
-
195
-
196
-
197
-
198
-
199
-
200
-
201
-
202
-
203
-
204
-
205
-
206
-
207
-
208
-
209
-
210
-
211
-
212
-
213
-
214
-
215
-
216
-
217
-
218
-
219
-
220
-
221
-
222
-
223
-
224
-
225
-
226
-
227
-
228
-
229
-
230
-
231
-
232
-
233
-
234
-
235
-
236
-
237
-
238
-
239
-
240
-
241
-
242
-
243
-
244
-
245
-
246
-
247
-
248
 |
 |
103
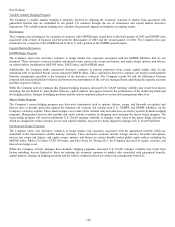
Equity Risk
Equity risk is defined as the risk of financial loss due to changes in the value of global equities or equity indices. The Company has
exposure to equity risk from assets under management, embedded derivatives within the Company’ s variable annuities and assets that
support the Company’ s pension plans. Equity Risk on the Company’ s Variable Annuity products is mitigated through various hedging
programs. (See the Variable Annuity Hedge Program Section)
The Company’ s exposure to equity risk includes the potential for lower earnings associated with certain of the Wealth Management’ s
businesses such as variable annuities where fee income is earned based upon the fair value of the assets under management. For further
discussion of equity risk, see the Variable Product Guarantee Risks and Risk Management section below. In addition, Wealth
Management offers certain guaranteed benefits, primarily associated with variable annuity products, which increases the Company’ s
potential benefit exposure as the equity markets decline.
The Company is also subject to equity risk based upon the assets that support its pension plans. The asset allocation mix is reviewed on
a periodic basis. In order to minimize risk, the pension plans maintain a listing of permissible and prohibited investments. In addition,
the pension plans have certain concentration limits and investment quality requirements imposed on permissible investment options.
For further discussion of equity risk associated with the pension plans, see the Critical Accounting Estimates section of the MD&A
under “Pension and Other Postretirement Benefit Obligations” and Note 17 of the Notes to Consolidated Financial Statements.
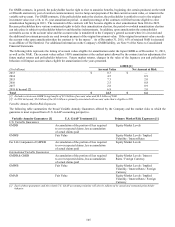
Variable Product Guarantee Risks and Risk Management
The Company’ s variable products are significantly influenced by the U.S., Japanese, and other equity markets. Increases or declines in
equity markets impact certain assets and liabilities related to the Company’ s variable products and the Company’ s earnings derived from
those products. The Company’ s variable products include variable annuity contracts, mutual funds, and variable life insurance.
Generally, declines in equity markets will:
• reduce the value of assets under management and the amount of fee income generated from those assets;
• reduce the value of equity securities trading supporting the international variable annuities, the related policyholder funds and
benefits payable, and the amount of fee income generated from those variable annuities;
• increase the liability for GMWB benefits resulting in realized capital losses;
• increase the value of derivative assets used to hedge product guarantees resulting in realized capital gains;
• increase the costs of the hedging instruments we use in our hedging program;
• increase the Company’ s net amount at risk for GMDB and GMIB benefits;
• decrease the Company’ s actual gross profits, resulting in increased DAC amortization;
• increase the amount of required assets to be held backing variable annuity guarantees to maintain required regulatory reserve
levels and targeted risk based capital ratios;
• adversely affect customer sentiment toward equity-linked products, causing a decline in sales; and
• decrease the Company’ s estimated future gross profits. See Estimated Gross Profits Used in the Valuation and Amortization
of Assets and Liabilities Associated with Variable Annuity and Other Universal Life-Type Contracts within the Critical
Accounting Estimates section of the MD&A for further information.
Generally, increases in equity markets will reduce the value of the dynamic hedge program and macro hedge derivative assets, resulting
in realized capital losses, and will generally have the inverse impact of those listed above. See section on Variable Annuity Hedging
Program for more information.