The Hartford 2011 Annual Report Download - page 145
Download and view the complete annual report
Please find page 145 of the 2011 The Hartford annual report below. You can navigate through the pages in the report by either clicking on the pages listed below, or by using the keyword search tool below to find specific information within the annual report.-
 1
1 -
2
-
3
-
4
-
5
-
6
-
7
-
8
-
9
-
10
-
11
-
12
-
13
-
14
-
15
-
16
-
17
-
18
-
19
-
20
-
21
-
22
-
23
-
24
-
25
-
26
-
27
-
28
-
29
-
30
-
31
-
32
-
33
-
34
-
35
-
36
-
37
-
38
-
39
-
40
-
41
-
42
-
43
-
44
-
45
-
46
-
47
-
48
-
49
-
50
-
51
-
52
-
53
-
54
-
55
-
56
-
57
-
58
-
59
-
60
-
61
-
62
-
63
-
64
-
65
-
66
-
67
-
68
-
69
-
70
-
71
-
72
-
73
-
74
-
75
-
76
-
77
-
78
-
79
-
80
-
81
-
82
-
83
-
84
-
85
-
86
-
87
-
88
-
89
-
90
-
91
-
92
-
93
-
94
-
95
-
96
-
97
-
98
-
99
-
100
-
101
-
102
-
103
-
104
-
105
-
106
-
107
-
108
-
109
-
110
-
111
-
112
-
113
-
114
-
115
-
116
-
117
-
118
-
119
-
120
-
121
-
122
-
123
-
124
-
125
-
126
-
127
-
128
-
129
-
130
-
131
-
132
-
133
-
134
-
 135
135 -
 136
136 -
 137
137 -
 138
138 -
 139
139 -
 140
140 -
 141
141 -
 142
142 -
 143
143 -
 144
144 -
 145
145 -
 146
146 -
 147
147 -
 148
148 -
 149
149 -
 150
150 -
 151
151 -
 152
152 -
 153
153 -
 154
154 -
 155
155 -
156
-
157
-
158
-
159
-
160
-
161
-
162
-
163
-
164
-
165
-
166
-
167
-
168
-
169
-
170
-
171
-
172
-
173
-
174
-
175
-
176
-
177
-
178
-
179
-
180
-
181
-
182
-
183
-
184
-
185
-
186
-
187
-
188
-
189
-
190
-
191
-
192
-
193
-
194
-
195
-
196
-
197
-
198
-
199
-
200
-
201
-
202
-
203
-
204
-
205
-
206
-
207
-
208
-
209
-
210
-
211
-
212
-
213
-
214
-
215
-
216
-
217
-
218
-
219
-
220
-
221
-
222
-
223
-
224
-
225
-
226
-
227
-
228
-
229
-
230
-
231
-
232
-
233
-
234
-
235
-
236
-
237
-
238
-
239
-
240
-
241
-
242
-
243
-
244
-
245
-
246
-
247
-
248
 |
 |
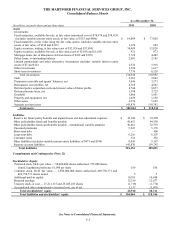
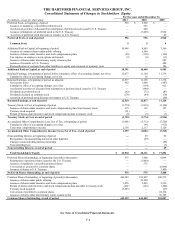
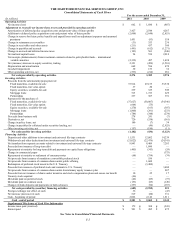
THE HARTFORD FINANCIAL SERVICES GROUP, INC.
NOTES TO CONSOLIDATED FINANCIAL STATEMENTS (continued)
F-10
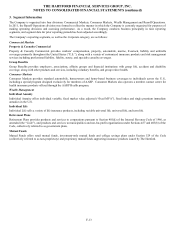
1. Basis of Presentation and Accounting Policies (continued)
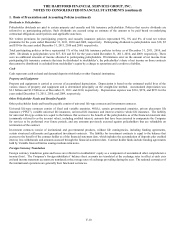
Dividends to Policyholders
Policyholder dividends are paid to certain property and casualty and life insurance policyholders. Policies that receive dividends are
referred to as participating policies. Such dividends are accrued using an estimate of the amount to be paid based on underlying
contractual obligations under policies and applicable state laws.
Net written premiums for participating property and casualty insurance policies represented 9%, 8% and 8% of total net written
premiums for the years ended December 31, 2011, 2010 and 2009, respectively. Participating dividends to policyholders were $18, $5
and $10 for the years ended December 31, 2011, 2010 and 2009, respectively.
Total participating policies in-force represented 1% of the total life insurance policies in-force as of December 31, 2011, 2010, and
2009. Dividends to policyholders were $17, $21 and $13 for the years ended December 31, 2011, 2010, and 2009, respectively. There
were no additional amounts of income allocated to participating policyholders. If limitations exist on the amount of net income from
participating life insurance contracts that may be distributed to stockholder’ s, the policyholder’ s share of net income on those contracts
that cannot be distributed is excluded from stockholder’ s equity by a charge to operations and a credit to a liability.
Cash
Cash represents cash on hand and demand deposits with banks or other financial institutions.
Property and Equipment
Property and equipment is carried at cost net of accumulated depreciation. Depreciation is based on the estimated useful lives of the
various classes of property and equipment and is determined principally on the straight-line method. Accumulated depreciation was
$2.1 billion and $1.9 billion as of December 31, 2011 and 2010, respectively. Depreciation expense was $216, $276, and $253 for the
years ended December 31, 2011, 2010, and 2009, respectively.
Other Policyholder Funds and Benefits Payable
Other policyholder funds and benefits payable consist of universal life-type contracts and investment contracts.
Universal life-type contracts consist of fixed and variable annuities, 401(k), certain governmental annuities, private placement life
insurance (“PPLI”), variable universal life insurance, universal life insurance and interest sensitive whole life insurance. The liability
for universal life-type contracts is equal to the balance that accrues to the benefit of the policyholders as of the financial statement date
(commonly referred to as the account value), including credited interest, amounts that have been assessed to compensate the Company
for services to be performed over future periods, and any amounts previously assessed against policyholders that are refundable on
termination of the contract.
Investment contracts consist of institutional and governmental products, without life contingencies, including funding agreements,
certain structured settlements and guaranteed investment contracts. The liability for investment contracts is equal to the balance that
accrues to the benefit of the contract holder as of the financial statement date, which includes the accumulation of deposits plus credited
interest, less withdrawals and amounts assessed through the financial statement date. Contract holder funds include funding agreements
held by Variable Interest Entities issuing medium-term notes.
Foreign Currency Translation
Foreign currency translation gains and losses are reflected in stockholders’ equity as a component of accumulated other comprehensive
income (loss). The Company’ s foreign subsidiaries’ balance sheet accounts are translated at the exchange rates in effect at each year
end and income statement accounts are translated at the average rates of exchange prevailing during the year. The national currencies of
the international operations are generally their functional currencies.