HSBC 2002 Annual Report Download - page 96
Download and view the complete annual report
Please find page 96 of the 2002 HSBC annual report below. You can navigate through the pages in the report by either clicking on the pages listed below, or by using the keyword search tool below to find specific information within the annual report.-
 1
1 -
2
-
3
-
4
-
5
-
6
-
7
-
8
-
9
-
10
-
11
-
12
-
13
-
14
-
15
-
16
-
17
-
18
-
19
-
20
-
21
-
22
-
23
-
24
-
25
-
26
-
27
-
28
-
29
-
30
-
31
-
32
-
33
-
34
-
35
-
36
-
37
-
38
-
39
-
40
-
41
-
42
-
43
-
44
-
45
-
46
-
47
-
48
-
49
-
50
-
51
-
52
-
53
-
54
-
55
-
56
-
57
-
58
-
59
-
60
-
61
-
62
-
63
-
64
-
65
-
66
-
67
-
68
-
69
-
70
-
71
-
72
-
73
-
74
-
75
-
76
-
77
-
78
-
79
-
80
-
81
-
82
-
83
-
84
-
85
-
 86
86 -
 87
87 -
 88
88 -
 89
89 -
 90
90 -
 91
91 -
 92
92 -
 93
93 -
 94
94 -
 95
95 -
 96
96 -
 97
97 -
 98
98 -
 99
99 -
 100
100 -
 101
101 -
 102
102 -
 103
103 -
 104
104 -
 105
105 -
 106
106 -
107
-
108
-
109
-
110
-
111
-
112
-
113
-
114
-
115
-
116
-
117
-
118
-
119
-
120
-
121
-
122
-
123
-
124
-
125
-
126
-
127
-
128
-
129
-
130
-
131
-
132
-
133
-
134
-
135
-
136
-
137
-
138
-
139
-
140
-
141
-
142
-
143
-
144
-
145
-
146
-
147
-
148
-
149
-
150
-
151
-
152
-
153
-
154
-
155
-
156
-
157
-
158
-
159
-
160
-
161
-
162
-
163
-
164
-
165
-
166
-
167
-
168
-
169
-
170
-
171
-
172
-
173
-
174
-
175
-
176
-
177
-
178
-
179
-
180
-
181
-
182
-
183
-
184
-
185
-
186
-
187
-
188
-
189
-
190
-
191
-
192
-
193
-
194
-
195
-
196
-
197
-
198
-
199
-
200
-
201
-
202
-
203
-
204
-
205
-
206
-
207
-
208
-
209
-
210
-
211
-
212
-
213
-
214
-
215
-
216
-
217
-
218
-
219
-
220
-
221
-
222
-
223
-
224
-
225
-
226
-
227
-
228
-
229
-
230
-
231
-
232
-
233
-
234
-
235
-
236
-
237
-
238
-
239
-
240
-
241
-
242
-
243
-
244
-
245
-
246
-
247
-
248
-
249
-
250
-
251
-
252
-
253
-
254
-
255
-
256
-
257
-
258
-
259
-
260
-
261
-
262
-
263
-
264
-
265
-
266
-
267
-
268
-
269
-
270
-
271
-
272
-
273
-
274
-
275
-
276
-
277
-
278
-
279
-
280
-
281
-
282
-
283
-
284
-
285
-
286
-
287
-
288
-
289
-
290
-
291
-
292
-
293
-
294
-
295
-
296
-
297
-
298
-
299
-
300
-
301
-
302
-
303
-
304
-
305
-
306
-
307
-
308
-
309
-
310
-
311
-
312
-
313
-
314
-
315
-
316
-
317
-
318
-
319
-
320
-
321
-
322
-
323
-
324
-
325
-
326
-
327
-
328
-
329
 |
 |

HSBC HOLDINGS PLC
Financial Review (continued)
94
reflecting a decline in customer activity, lower
disposal gains and costs associated with
restructuring the business.
Net interest income was broadly in line.
Offsetting the effect of a full year’ s income from
CCF entities, the underlying change mainly reflects
a switch to lower yielding assets and a lower
benefit from free capital as interest rates fell and a
more conservative risk profile was taken.
Net fees and commissions rose by US$47
million or 8 per cent on the year. US$40 million of
this rise occurred in Europe again mainly due to the
impact of including a full year of results for CCF.
North America increased fee income by US$17
million on fees generated from increased assets
under management.
Operating expenses increased by US$160
million or 21 per cent and included a US$144
million rise in staff costs and US$33 million of
increased premises and equipment expenses. The
greatest increase in costs was in Europe, where
expenses rose by US$122 million, mainly due to
the inclusion of a full year’ s costs for CCF.
Excluding CCF, costs in Europe were up by US$34
million, in part relating to the cost of restructuring
the Group’s private banking operations during
2001 and the expansion of headcount as part of
business growth.
There was a net write-back of provisions for
bad and doubtful debts, amounting to US$24
million, against a net charge of US$6 million in
2000. The reduction reflected a write-back of
general provisions in Switzerland following a
review of the level of provisions held in the light of
historical loan loss experience.
The US$46 million of provisions for
contingent liabilities and commitments included
US$31m relating to CCF’s operation in Lebanon,
now closed, and smaller amounts relating to a
number of individual items of litigation.
Private Banking achieved US$5 million of gains on
the disposal of fixed asset investments, compared
with US$19 million in 2000.
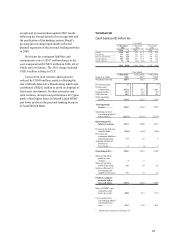
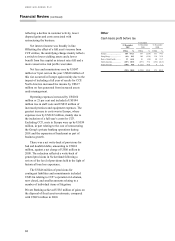
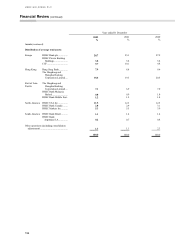
Other
Cash basis profit before tax
Year ende
d
31 December
2002
31 December
2001
31 December
2000
US$m % US$
m
%US$
m
%
Europe .............................. 155
(
77.1
)
357 (23.4 ) 351 94.1
Hong Kong .......................
(
61
)
30.3 198 (13.0 ) 134 35.9
Rest of Asia-Pacific........... 12
(
6.0
)
30 (2.0 ) 40 10.7
North Americ
a
..................
(
207
)
103.0 (877 ) 57.6 (156 ) (41.8 )
South Americ
a
..................
(
100
)
49.8 (1,232 ) 80.8 4 1.1
(
201
)
100.0 (1,524 ) 100.0 373 100.0