HSBC 2002 Annual Report Download - page 4
Download and view the complete annual report
Please find page 4 of the 2002 HSBC annual report below. You can navigate through the pages in the report by either clicking on the pages listed below, or by using the keyword search tool below to find specific information within the annual report.-
 1
1 -
 2
2 -
 3
3 -
 4
4 -
 5
5 -
 6
6 -
 7
7 -
 8
8 -
 9
9 -
 10
10 -
 11
11 -
 12
12 -
 13
13 -
 14
14 -
 15
15 -
16
-
17
-
18
-
19
-
20
-
21
-
22
-
23
-
24
-
25
-
26
-
27
-
28
-
29
-
30
-
31
-
32
-
33
-
34
-
35
-
36
-
37
-
38
-
39
-
40
-
41
-
42
-
43
-
44
-
45
-
46
-
47
-
48
-
49
-
50
-
51
-
52
-
53
-
54
-
55
-
56
-
57
-
58
-
59
-
60
-
61
-
62
-
63
-
64
-
65
-
66
-
67
-
68
-
69
-
70
-
71
-
72
-
73
-
74
-
75
-
76
-
77
-
78
-
79
-
80
-
81
-
82
-
83
-
84
-
85
-
86
-
87
-
88
-
89
-
90
-
91
-
92
-
93
-
94
-
95
-
96
-
97
-
98
-
99
-
100
-
101
-
102
-
103
-
104
-
105
-
106
-
107
-
108
-
109
-
110
-
111
-
112
-
113
-
114
-
115
-
116
-
117
-
118
-
119
-
120
-
121
-
122
-
123
-
124
-
125
-
126
-
127
-
128
-
129
-
130
-
131
-
132
-
133
-
134
-
135
-
136
-
137
-
138
-
139
-
140
-
141
-
142
-
143
-
144
-
145
-
146
-
147
-
148
-
149
-
150
-
151
-
152
-
153
-
154
-
155
-
156
-
157
-
158
-
159
-
160
-
161
-
162
-
163
-
164
-
165
-
166
-
167
-
168
-
169
-
170
-
171
-
172
-
173
-
174
-
175
-
176
-
177
-
178
-
179
-
180
-
181
-
182
-
183
-
184
-
185
-
186
-
187
-
188
-
189
-
190
-
191
-
192
-
193
-
194
-
195
-
196
-
197
-
198
-
199
-
200
-
201
-
202
-
203
-
204
-
205
-
206
-
207
-
208
-
209
-
210
-
211
-
212
-
213
-
214
-
215
-
216
-
217
-
218
-
219
-
220
-
221
-
222
-
223
-
224
-
225
-
226
-
227
-
228
-
229
-
230
-
231
-
232
-
233
-
234
-
235
-
236
-
237
-
238
-
239
-
240
-
241
-
242
-
243
-
244
-
245
-
246
-
247
-
248
-
249
-
250
-
251
-
252
-
253
-
254
-
255
-
256
-
257
-
258
-
259
-
260
-
261
-
262
-
263
-
264
-
265
-
266
-
267
-
268
-
269
-
270
-
271
-
272
-
273
-
274
-
275
-
276
-
277
-
278
-
279
-
280
-
281
-
282
-
283
-
284
-
285
-
286
-
287
-
288
-
289
-
290
-
291
-
292
-
293
-
294
-
295
-
296
-
297
-
298
-
299
-
300
-
301
-
302
-
303
-
304
-
305
-
306
-
307
-
308
-
309
-
310
-
311
-
312
-
313
-
314
-
315
-
316
-
317
-
318
-
319
-
320
-
321
-
322
-
323
-
324
-
325
-
326
-
327
-
328
-
329
 |
 |

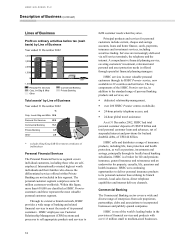
HSBC HOLDINGS PLC
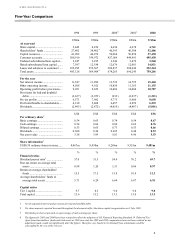
Financial Highlights (continued)
2
2002 2001
Performance ratios % %
On a cash basis
Return on invested capital ........................................................................... 12.8 11.2
Return on net tangible equity........................................................... 19.8 17.4
Post-tax return on average tangible assets........................................ 1.11 1.00
Post-tax return on average risk-weighted assets .............................. 1.95 1.76
On a reported basis
Return on average shareholders’ funds............................................ 12.3 10.4
Post-tax return on average assets .................................................... 0.97 0.86
Post-tax return on average risk-weighted assets .............................. 1.74 1.55
Efficiency and revenue mix ratios
Cost:income ratio (excluding goodwill amortisation)...................... 56.2 56.4
As a percentage of total operating income:
– net interest income ....................................................................... 58.1 56.9
– other operating income................................................................. 41.9 43.1
– net fees and commissions............................................................. 29.4 28.9
– dealing profits............................................................................... 4.9 6.5
Capital ratios
Tier 1 capital.................................................................................... 9.0 9.0
Total capital ..................................................................................... 13.3 13.0
¶Figures for 2001, excluding average risk-weighted assets, have been restated to reflect the adoption of UK Financial Reporting
Standard 19 ‘Deferred Tax’, details of which are set out in Note 1 on the Financial Statements on pages 195 to 197.
The following explains the non-GAAP cash basis measures and how they are derived from the equivalent reported
measures.
The cash basis operating profit before provisions can be reconciled to the equivalent reported measure by
deducting goodwill amortisation of US$854 million and US$799 million for 2002 and 2001 respectively.
The cash basis profit on ordinary activities before tax and cash basis profit attributable to shareholders can be
reconciled to the equivalent reported measures by deducting goodwill amortisation, including that attributable to
joint ventures, of US$863 million and US$807 million for 2002 and 2001, respectively.
Cash basis earnings per ordinary share are calculated by dividing cash basis profit attributable to shareholders
(as explained above) by the weighted average number of ordinary shares in issue during the year which is the same
number used in the calculation of basic earnings per share on a reported basis.
The definition of return on invested capital and a reconciliation to the equivalent GAAP measures is set out on
page 53.
Average net tangible equity and average tangible assets are calculated by deducting average purchased goodwill
net of cumulative amortisation of US$15.0 billion. The calculation of both the cash basis and reported basis average
risk-weighted assets are derived from the same regulatory measure.