HSBC 2002 Annual Report Download - page 100
Download and view the complete annual report
Please find page 100 of the 2002 HSBC annual report below. You can navigate through the pages in the report by either clicking on the pages listed below, or by using the keyword search tool below to find specific information within the annual report.-
 1
1 -
2
-
3
-
4
-
5
-
6
-
7
-
8
-
9
-
10
-
11
-
12
-
13
-
14
-
15
-
16
-
17
-
18
-
19
-
20
-
21
-
22
-
23
-
24
-
25
-
26
-
27
-
28
-
29
-
30
-
31
-
32
-
33
-
34
-
35
-
36
-
37
-
38
-
39
-
40
-
41
-
42
-
43
-
44
-
45
-
46
-
47
-
48
-
49
-
50
-
51
-
52
-
53
-
54
-
55
-
56
-
57
-
58
-
59
-
60
-
61
-
62
-
63
-
64
-
65
-
66
-
67
-
68
-
69
-
70
-
71
-
72
-
73
-
74
-
75
-
76
-
77
-
78
-
79
-
80
-
81
-
82
-
83
-
84
-
85
-
86
-
87
-
88
-
89
-
 90
90 -
 91
91 -
 92
92 -
 93
93 -
 94
94 -
 95
95 -
 96
96 -
 97
97 -
 98
98 -
 99
99 -
 100
100 -
 101
101 -
 102
102 -
 103
103 -
 104
104 -
 105
105 -
 106
106 -
 107
107 -
 108
108 -
 109
109 -
 110
110 -
111
-
112
-
113
-
114
-
115
-
116
-
117
-
118
-
119
-
120
-
121
-
122
-
123
-
124
-
125
-
126
-
127
-
128
-
129
-
130
-
131
-
132
-
133
-
134
-
135
-
136
-
137
-
138
-
139
-
140
-
141
-
142
-
143
-
144
-
145
-
146
-
147
-
148
-
149
-
150
-
151
-
152
-
153
-
154
-
155
-
156
-
157
-
158
-
159
-
160
-
161
-
162
-
163
-
164
-
165
-
166
-
167
-
168
-
169
-
170
-
171
-
172
-
173
-
174
-
175
-
176
-
177
-
178
-
179
-
180
-
181
-
182
-
183
-
184
-
185
-
186
-
187
-
188
-
189
-
190
-
191
-
192
-
193
-
194
-
195
-
196
-
197
-
198
-
199
-
200
-
201
-
202
-
203
-
204
-
205
-
206
-
207
-
208
-
209
-
210
-
211
-
212
-
213
-
214
-
215
-
216
-
217
-
218
-
219
-
220
-
221
-
222
-
223
-
224
-
225
-
226
-
227
-
228
-
229
-
230
-
231
-
232
-
233
-
234
-
235
-
236
-
237
-
238
-
239
-
240
-
241
-
242
-
243
-
244
-
245
-
246
-
247
-
248
-
249
-
250
-
251
-
252
-
253
-
254
-
255
-
256
-
257
-
258
-
259
-
260
-
261
-
262
-
263
-
264
-
265
-
266
-
267
-
268
-
269
-
270
-
271
-
272
-
273
-
274
-
275
-
276
-
277
-
278
-
279
-
280
-
281
-
282
-
283
-
284
-
285
-
286
-
287
-
288
-
289
-
290
-
291
-
292
-
293
-
294
-
295
-
296
-
297
-
298
-
299
-
300
-
301
-
302
-
303
-
304
-
305
-
306
-
307
-
308
-
309
-
310
-
311
-
312
-
313
-
314
-
315
-
316
-
317
-
318
-
319
-
320
-
321
-
322
-
323
-
324
-
325
-
326
-
327
-
328
-
329
 |
 |

HSBC HOLDINGS PLC
Financial Review (continued)
98
established on the basis of management’s judgement.
Where management’ s judgement is that the
expected cashflows of an IGU have declined and/or
that its cost of capital has increased, the effect will be
to reduce the estimated fair value of the IGU. If this
results in a fair value that is lower than the carrying
value of the IGU, an impairment of goodwill will be
recorded.
Valuation of unquoted and illiquid debt and
equity securities
HSBC’s accounting policy for these instruments is
described in Note 2 (c) on page 199 of the financial
statements.
HSBC carries its debt and equity securities held
for trading purposes at fair value. For those debt and
equity securities which are not carried at fair value,
the fair value of the security is taken into
consideration in determining whether the asset
should be written down to reflect a permanent
impairment.
The fair value determined for unquoted and
illiquid debt and equity securities reflects
management’s assessment of the value of these
securities. This assessment may be based upon the
use of a discounted cashflow model (particularly for
debt securities) or determined by looking directly at
the valuation of comparable securities for which an
independent price can be established.
The main factors which management consider
when applying a cashflow model are:
• the likelihood and expected timing of future
cashflows on the instrument. These cashflows
are usually determined by the terms of the
instrument, although management judgement
may be required in situations where the ability
of the counterparty to service the instrument in
accordance with its contractual terms is in
doubt; and
• an appropriate discount rate for the instrument.
Again management determines this rate, based
on its assessment of the appropriate spread of
the rate for the instrument over the risk free rate.
Where management values the instrument by
reference to comparable securities, the basis of
valuation takes account of the maturity, structure and
rating of the security to which the position held is
being compared.
In assessing the valuation of securities,
management also takes account of the size of the
position held relative to market liquidity and
conditions. Where considered appropriate, the
assessed fair value of the securities will be reduced
to reflect the amount which management estimate
could be realised on their sale.
Changes in any of the assumptions used by
management to determine the valuation will give rise
to changes in the recorded fair value of unquoted
securities. Such changes will result in changes in the
carrying value of the securities where they are
carried at fair value. Where the securities are carried
at amortised cost, changes in their estimated fair
value, arising from changes in management’ s
assumptions on the above variables, may result in the
recording of a permanent diminution in their value.
In this case, it will also be necessary for HSBC’ s
management to exercise judgement as to whether or
not changes in the underlying valuation assumptions
are only temporary.
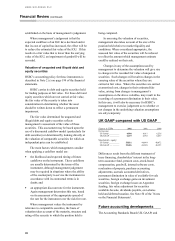
UK GAAP compared with US GAAP
Figures in US$m 2002 2001 2000
Net income:
US GAAP................... 4,900 4,911 6,236
UK GAAP .................. 6,239 4,992 6,457
Shareholder’ s equity:
US GAAP................... 55,831 48,444 48,072
UK GAAP .................. 52,406 46,388 46,393
Differences result from the different treatment of
lease financing, shareholders’ interest in the long-
term assurance fund, pension costs, stock-based
compensation, goodwill, internal software costs,
revaluation of property, purchase accounting
adjustments, accruals accounted derivatives,
permanent diminution in value of available-for-sale
securities, foreign exchange gains on investment
securities, foreign exchange losses on Argentine
funding, fair value adjustment for securities
available-for-sale, dividends payable, own shares
held and deferred taxation. See Note 50 of the ‘Notes
on the Financial Statements’ .
Future accounting developments
The Accounting Standards Board (UK GAAP) and