HSBC 2002 Annual Report Download - page 89
Download and view the complete annual report
Please find page 89 of the 2002 HSBC annual report below. You can navigate through the pages in the report by either clicking on the pages listed below, or by using the keyword search tool below to find specific information within the annual report.-
 1
1 -
2
-
3
-
4
-
5
-
6
-
7
-
8
-
9
-
10
-
11
-
12
-
13
-
14
-
15
-
16
-
17
-
18
-
19
-
20
-
21
-
22
-
23
-
24
-
25
-
26
-
27
-
28
-
29
-
30
-
31
-
32
-
33
-
34
-
35
-
36
-
37
-
38
-
39
-
40
-
41
-
42
-
43
-
44
-
45
-
46
-
47
-
48
-
49
-
50
-
51
-
52
-
53
-
54
-
55
-
56
-
57
-
58
-
59
-
60
-
61
-
62
-
63
-
64
-
65
-
66
-
67
-
68
-
69
-
70
-
71
-
72
-
73
-
74
-
75
-
76
-
77
-
78
-
 79
79 -
 80
80 -
 81
81 -
 82
82 -
 83
83 -
 84
84 -
 85
85 -
 86
86 -
 87
87 -
 88
88 -
 89
89 -
 90
90 -
 91
91 -
 92
92 -
 93
93 -
 94
94 -
 95
95 -
 96
96 -
 97
97 -
 98
98 -
 99
99 -
100
-
101
-
102
-
103
-
104
-
105
-
106
-
107
-
108
-
109
-
110
-
111
-
112
-
113
-
114
-
115
-
116
-
117
-
118
-
119
-
120
-
121
-
122
-
123
-
124
-
125
-
126
-
127
-
128
-
129
-
130
-
131
-
132
-
133
-
134
-
135
-
136
-
137
-
138
-
139
-
140
-
141
-
142
-
143
-
144
-
145
-
146
-
147
-
148
-
149
-
150
-
151
-
152
-
153
-
154
-
155
-
156
-
157
-
158
-
159
-
160
-
161
-
162
-
163
-
164
-
165
-
166
-
167
-
168
-
169
-
170
-
171
-
172
-
173
-
174
-
175
-
176
-
177
-
178
-
179
-
180
-
181
-
182
-
183
-
184
-
185
-
186
-
187
-
188
-
189
-
190
-
191
-
192
-
193
-
194
-
195
-
196
-
197
-
198
-
199
-
200
-
201
-
202
-
203
-
204
-
205
-
206
-
207
-
208
-
209
-
210
-
211
-
212
-
213
-
214
-
215
-
216
-
217
-
218
-
219
-
220
-
221
-
222
-
223
-
224
-
225
-
226
-
227
-
228
-
229
-
230
-
231
-
232
-
233
-
234
-
235
-
236
-
237
-
238
-
239
-
240
-
241
-
242
-
243
-
244
-
245
-
246
-
247
-
248
-
249
-
250
-
251
-
252
-
253
-
254
-
255
-
256
-
257
-
258
-
259
-
260
-
261
-
262
-
263
-
264
-
265
-
266
-
267
-
268
-
269
-
270
-
271
-
272
-
273
-
274
-
275
-
276
-
277
-
278
-
279
-
280
-
281
-
282
-
283
-
284
-
285
-
286
-
287
-
288
-
289
-
290
-
291
-
292
-
293
-
294
-
295
-
296
-
297
-
298
-
299
-
300
-
301
-
302
-
303
-
304
-
305
-
306
-
307
-
308
-
309
-
310
-
311
-
312
-
313
-
314
-
315
-
316
-
317
-
318
-
319
-
320
-
321
-
322
-
323
-
324
-
325
-
326
-
327
-
328
-
329
 |
 |

87
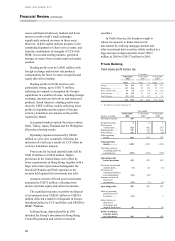
exceptional provision taken against 2001 results
following the formal default of sovereign debt and
the pesification of the banking system. Brazil’s
growing provisioning requirements reflected
planned expansion of the personal lending portfolio
in 2000.
Provisions for contingent liabilities and
commitments saw a US$17 million charge in the
year, compared with US$31 million in 2000, all of
which arose in Europe. The 2001 charge included
US$13 million relating to CCF.
Losses from joint ventures and associates
reduced by US$40 million, mainly reflecting the
sale of British Interactive Broadcasting which also
contributed US$202 million to profit on disposal of
fixed asset investments. In other associates and
joint ventures, an improved performance in Cyprus
partly offset higher losses in Merrill Lynch HSBC
and lower profits in the personal banking business
of Saudi British Bank.
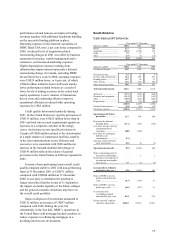
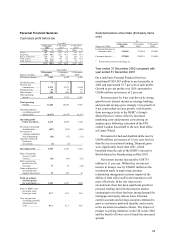
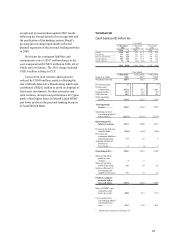
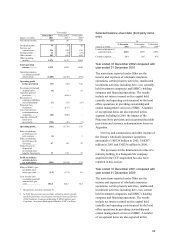
Commercial
Cash basis profit before tax
Year ended
31 December
2002
31 December
2001
31 December
2000
US$m % US$m % US$m %
Europe................................ 1,344 44.3 986 41.4 1,139 41.0
Hong Kong......................... 733 24.2 726 30.4 781 28.1
Rest of Asia-Pacific ............ 423 13.9 277 11.6 376 13.5
North America.................... 455 15.0 410 17.2 387 13.9
South America.................... 79 2.6 (14 ) (0.6 ) 97 3.5
3,034 100.0 2,385 100.0 2,780 100.0
Year ended
Figures in US$m 31 December
2002
31 December
2001*
31 December
2000*
Net interest income 3,855 3,821 3,541
Dividend income.... 673
Net fees and
commissions...... 1,934 1,751 1,681
Dealing profits ....... 107 103 82
Other income.......... 463 422 368
Other operating
income............... 2,510 2,283 2,134
Total operating
income .............. 6,365 6,104 5,675
Operating expenses
(excluding goodwill
amortisation) ..... (3,153 ) (3,116 ) (2,738)
Operating profit
before provisions 3,212 2,988 2,937
Provisions for bad and
doubtful debts.... (269) (662) (202 )
Provisions for
contingent liabilities
and commitments 19 16 5
Amounts written off
fixed asset
investments ....... 3(1) 2
Operating profit ... 2,965 2,341 2,742
Share of operating
profit in joint
ventures............. 26
–
Share of operating
profit in associates 16 28 26
Gains on disposal of
investments and
tangible fixed assets 51 10 12
Profit on ordinary
activities before
tax (cash basis). 3,034 2,385 2,780
Share of HSBC’ s pre-
tax profits (cash
basis) (per cent). 28.8 27.1 27.0
Cost: income ratio
(excluding goodwill
amotisation) (per
cent) .................. 49.5 51.0 48.2
*Restatement consistent with page 81