HSBC 2002 Annual Report Download - page 41
Download and view the complete annual report
Please find page 41 of the 2002 HSBC annual report below. You can navigate through the pages in the report by either clicking on the pages listed below, or by using the keyword search tool below to find specific information within the annual report.-
 1
1 -
2
-
3
-
4
-
5
-
6
-
7
-
8
-
9
-
10
-
11
-
12
-
13
-
14
-
15
-
16
-
17
-
18
-
19
-
20
-
21
-
22
-
23
-
24
-
25
-
26
-
27
-
28
-
29
-
30
-
 31
31 -
 32
32 -
 33
33 -
 34
34 -
 35
35 -
 36
36 -
 37
37 -
 38
38 -
 39
39 -
 40
40 -
 41
41 -
 42
42 -
 43
43 -
 44
44 -
 45
45 -
 46
46 -
 47
47 -
 48
48 -
 49
49 -
 50
50 -
 51
51 -
52
-
53
-
54
-
55
-
56
-
57
-
58
-
59
-
60
-
61
-
62
-
63
-
64
-
65
-
66
-
67
-
68
-
69
-
70
-
71
-
72
-
73
-
74
-
75
-
76
-
77
-
78
-
79
-
80
-
81
-
82
-
83
-
84
-
85
-
86
-
87
-
88
-
89
-
90
-
91
-
92
-
93
-
94
-
95
-
96
-
97
-
98
-
99
-
100
-
101
-
102
-
103
-
104
-
105
-
106
-
107
-
108
-
109
-
110
-
111
-
112
-
113
-
114
-
115
-
116
-
117
-
118
-
119
-
120
-
121
-
122
-
123
-
124
-
125
-
126
-
127
-
128
-
129
-
130
-
131
-
132
-
133
-
134
-
135
-
136
-
137
-
138
-
139
-
140
-
141
-
142
-
143
-
144
-
145
-
146
-
147
-
148
-
149
-
150
-
151
-
152
-
153
-
154
-
155
-
156
-
157
-
158
-
159
-
160
-
161
-
162
-
163
-
164
-
165
-
166
-
167
-
168
-
169
-
170
-
171
-
172
-
173
-
174
-
175
-
176
-
177
-
178
-
179
-
180
-
181
-
182
-
183
-
184
-
185
-
186
-
187
-
188
-
189
-
190
-
191
-
192
-
193
-
194
-
195
-
196
-
197
-
198
-
199
-
200
-
201
-
202
-
203
-
204
-
205
-
206
-
207
-
208
-
209
-
210
-
211
-
212
-
213
-
214
-
215
-
216
-
217
-
218
-
219
-
220
-
221
-
222
-
223
-
224
-
225
-
226
-
227
-
228
-
229
-
230
-
231
-
232
-
233
-
234
-
235
-
236
-
237
-
238
-
239
-
240
-
241
-
242
-
243
-
244
-
245
-
246
-
247
-
248
-
249
-
250
-
251
-
252
-
253
-
254
-
255
-
256
-
257
-
258
-
259
-
260
-
261
-
262
-
263
-
264
-
265
-
266
-
267
-
268
-
269
-
270
-
271
-
272
-
273
-
274
-
275
-
276
-
277
-
278
-
279
-
280
-
281
-
282
-
283
-
284
-
285
-
286
-
287
-
288
-
289
-
290
-
291
-
292
-
293
-
294
-
295
-
296
-
297
-
298
-
299
-
300
-
301
-
302
-
303
-
304
-
305
-
306
-
307
-
308
-
309
-
310
-
311
-
312
-
313
-
314
-
315
-
316
-
317
-
318
-
319
-
320
-
321
-
322
-
323
-
324
-
325
-
326
-
327
-
328
-
329
 |
 |
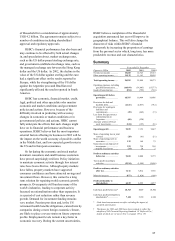
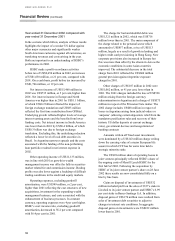
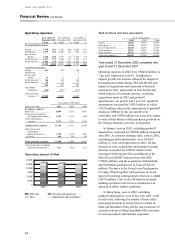
39
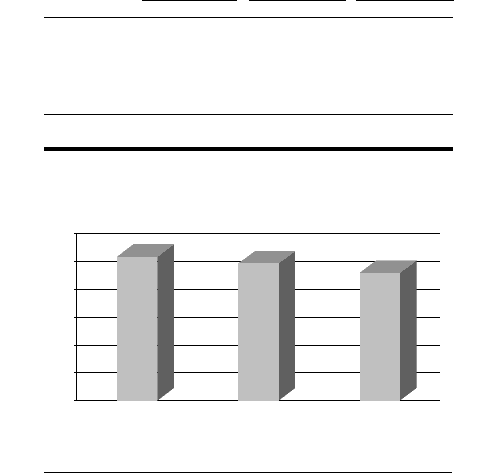
15,460
14,725 13,723
0
3,000
6,000
9,000
12,000
15,000
18,000
2002 2001 2000
Year ended 31 December 2001 compared with
year ended 31 December 2000
In the sections which follow, analysis of these results
highlights the contribution from CCF, acquired on 28
July 2000, and the impact of a stronger US dollar on
translating revenues and costs arising in other
currencies, each of which is significant to an
understanding of HSBC’s performance in 2001.
HSBC made a profit on ordinary activities
before tax of US$8,000 million in 2001, a decrease
of US$1,775 million, or 18 per cent, compared with
2000. On a cash basis, profit before tax decreased by
US$1,493 million, or 14 per cent, compared with
2000. At constant exchange rates, cash basis profit
before tax was 12 per cent lower than 2000.
Net interest income of US$14,725 million in
2001 was US$1,002 million, or 7 per cent, higher
than 2000, with a large part of this increase due to
the inclusion of CCF for a full year. Net interest
income in North America was US$265 million, or 12
per cent, higher than 2000 mainly reflecting growth
in average interest-earning assets and the benefit of
lower funding costs.
Other operating income rose by US$313 million,
or 3 per cent, to US$11,163 million compared with
2000. This increase was primarily driven by the
acquisition of CCF and by growth in wealth
management income which offset falls in securities-
related fee and commission income.
Operating expenses, excluding goodwill
amortisation, were US$1,028 million, or 8 per cent,
higher than 2000. This increase principally reflected
recent acquisitions.
HSBC’s cost: income ratio, excluding goodwill
amortisation, increased to 56.4 per cent compared
with 55.3 per cent in 2000, reflecting the cost
structures of new acquisitions and investment in the
expanding wealth management business and IT.
The charge for bad and doubtful debts was
US$2,037 million in 2001, which was US$1,105
million higher than in 2000. This mainly reflected
the US$600 million general provision against
Argentine exposure and specific provisions made
against a small number of corporate borrowers.
Other provisions included a loss of US$520 million
arising from the foreign currency redenomination in
Argentina and a charge of US$575 million for the
Princeton Note matter.
The US$91 million share of operating losses in
joint ventures principally reflected continuing start-
up costs of Merrill Lynch HSBC, now operational in
the UK, Canada and Australia.
The charge for amounts written-off fixed asset
investments arose mainly from venture capital
investments and holdings of emerging technology
stocks.
Gains on disposal of investments of US$754
million included profit on the sale of HSBC’s 20 per
cent stake in British Interactive Broadcasting and the
investment in Modern Terminals Limited. In
addition, disposal gains of US$170 million were
realised from sales of investment debt securities to
adjust to changes in interest rate conditions.
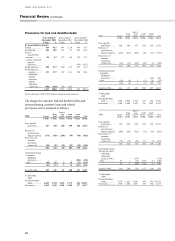
Net interest income
Year ended 31
December 2002
Year ended 31
December 2001
Year ended 31
December 2000
US$m % US$
m
%US$
m
%
Europe................ 6,343 41.0 5,563 37.8 4,988 36.4
Hong Kong......... 4,133 26.7 4,165 28.3 3,997 29.1
Rest of Asia-
Pacific ...........
1,607 10.4 1,482 10.1 1,367 10.0
North America ... 2,732 17.7 2,450 16.6 2,185 15.9
South America ... 645 4.2 1,065 7.2 1,186 8.6
Net interest
income........... 15,460 100.0 14,725 100.0 13,723 100.0
Net interest income (US$m)
Year ended 31 December
Figures in US$m 2002 2001 2000
Net interest income ............... 15,460 14,725 13,723
Average interest-earning
assets................................ 608,749 579,665 516,185
Gross interest yield
(per cent)1........................ 4.70 6.08 7.31
Net interest spread
(per cent) 2........................ 2.27 2.09 2.10
Net interest margin
(per cent)3 ........................ 2.54 2.54 2.66
1Gross interest yield is the average interest rate earned on average
interest-earning assets (AIEA).
2Net interest spread is the difference between the average interest
rate earned on average interest-earning assets and the average
interest rate paid on average interest-bearing funds.
3Net interest margin is net interest income expressed as a percentage
of average interest-earning assets.