HSBC 2002 Annual Report Download - page 50
Download and view the complete annual report
Please find page 50 of the 2002 HSBC annual report below. You can navigate through the pages in the report by either clicking on the pages listed below, or by using the keyword search tool below to find specific information within the annual report.-
 1
1 -
2
-
3
-
4
-
5
-
6
-
7
-
8
-
9
-
10
-
11
-
12
-
13
-
14
-
15
-
16
-
17
-
18
-
19
-
20
-
21
-
22
-
23
-
24
-
25
-
26
-
27
-
28
-
29
-
30
-
31
-
32
-
33
-
34
-
35
-
36
-
37
-
38
-
39
-
 40
40 -
 41
41 -
 42
42 -
 43
43 -
 44
44 -
 45
45 -
 46
46 -
 47
47 -
 48
48 -
 49
49 -
 50
50 -
 51
51 -
 52
52 -
 53
53 -
 54
54 -
 55
55 -
 56
56 -
 57
57 -
 58
58 -
 59
59 -
 60
60 -
61
-
62
-
63
-
64
-
65
-
66
-
67
-
68
-
69
-
70
-
71
-
72
-
73
-
74
-
75
-
76
-
77
-
78
-
79
-
80
-
81
-
82
-
83
-
84
-
85
-
86
-
87
-
88
-
89
-
90
-
91
-
92
-
93
-
94
-
95
-
96
-
97
-
98
-
99
-
100
-
101
-
102
-
103
-
104
-
105
-
106
-
107
-
108
-
109
-
110
-
111
-
112
-
113
-
114
-
115
-
116
-
117
-
118
-
119
-
120
-
121
-
122
-
123
-
124
-
125
-
126
-
127
-
128
-
129
-
130
-
131
-
132
-
133
-
134
-
135
-
136
-
137
-
138
-
139
-
140
-
141
-
142
-
143
-
144
-
145
-
146
-
147
-
148
-
149
-
150
-
151
-
152
-
153
-
154
-
155
-
156
-
157
-
158
-
159
-
160
-
161
-
162
-
163
-
164
-
165
-
166
-
167
-
168
-
169
-
170
-
171
-
172
-
173
-
174
-
175
-
176
-
177
-
178
-
179
-
180
-
181
-
182
-
183
-
184
-
185
-
186
-
187
-
188
-
189
-
190
-
191
-
192
-
193
-
194
-
195
-
196
-
197
-
198
-
199
-
200
-
201
-
202
-
203
-
204
-
205
-
206
-
207
-
208
-
209
-
210
-
211
-
212
-
213
-
214
-
215
-
216
-
217
-
218
-
219
-
220
-
221
-
222
-
223
-
224
-
225
-
226
-
227
-
228
-
229
-
230
-
231
-
232
-
233
-
234
-
235
-
236
-
237
-
238
-
239
-
240
-
241
-
242
-
243
-
244
-
245
-
246
-
247
-
248
-
249
-
250
-
251
-
252
-
253
-
254
-
255
-
256
-
257
-
258
-
259
-
260
-
261
-
262
-
263
-
264
-
265
-
266
-
267
-
268
-
269
-
270
-
271
-
272
-
273
-
274
-
275
-
276
-
277
-
278
-
279
-
280
-
281
-
282
-
283
-
284
-
285
-
286
-
287
-
288
-
289
-
290
-
291
-
292
-
293
-
294
-
295
-
296
-
297
-
298
-
299
-
300
-
301
-
302
-
303
-
304
-
305
-
306
-
307
-
308
-
309
-
310
-
311
-
312
-
313
-
314
-
315
-
316
-
317
-
318
-
319
-
320
-
321
-
322
-
323
-
324
-
325
-
326
-
327
-
328
-
329
 |
 |

HSBC HOLDINGS PLC
Financial Review (continued)
48
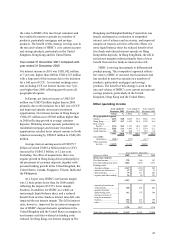
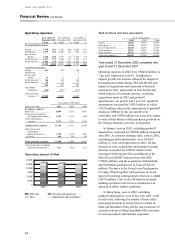
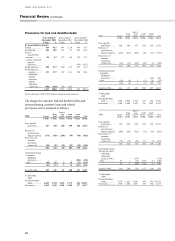
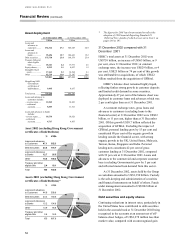
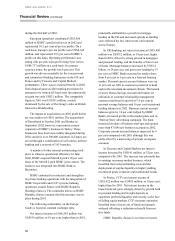
iii. new corporate provisions in Hong Kong
declined by US$48 million reflecting a
reduction in non-performing loans. As the
economy remained in deflation, high levels of
unemployment and the impact of new
bankruptcy laws significantly increased the
incidence of personal bankruptcy filings leading
to an increase of US$127 million in new
provisions against personal lending, principally
on credit cards.
• In aggregate, releases and recoveries decreased
by US$96 million compared with 2001. 2001
benefited from exceptional recoveries against an
historical Olympia and York exposure and from
successful restructuring and recoveries achieved
in Malaysia on corporate and commercial loans
impaired during the Asian economic crisis in the
late 1990s.
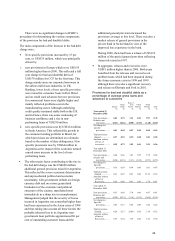
• Excluding Argentina, there was a net release of
general provisions of US$155 million compared
with a release of US$27 million in 2001. There
was a release of US$97 million in Hong Kong
reflecting a reduction in estimated latent loan
losses at 31 December 2002. The estimate of
these latent losses reflects the group’ s historical
experience of the rate at which such losses
occur and are identified, on the structure of the
credit portfolio and the economic and credit
conditions prevailing at the balance sheet date.
In the UK there was a release of some US$50
million of general provisions as a number of
corporate borrowers which had been causing
concern at the 2001 year end were specifically
provisioned against in 2002. In Argentina, an
additional general provision of US$600 million
(at constant exchange rates, US$292 million)
was raised at the end of 2001. In 2002, US$196
million of specific impairments were raised and
the general provision requirement was reduced
accordingly. As individual loans have become
impaired, this has caused an underlying increase
in the level of non-performing loans in South
America. The loss experience on corporate
credit in Argentina during 2002 has confirmed
that the level of general provisions established
in 2001 was appropriate. At the end of 2002,
specific and general provisions together
continued to cover about 60 per cent of non-
government loans in Argentina.
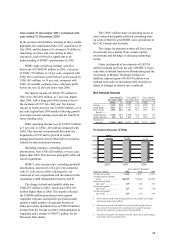
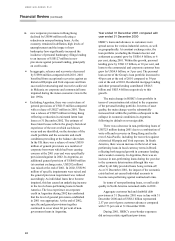
Year ended 31 December 2001 compared with
year ended 31 December 2000
HSBC’s loans and advances to customers were
spread across the various industrial sectors, as well
as geographically. At constant exchange rates, the
loan portfolio (excluding the financial sector and
settlement accounts) grew by US$16.4 billion, or 6
per cent, during 2001. Within this growth, personal
lending grew by US$11.5 billion, or 10 per cent, and
loans to the commercial and corporate customer base
grew by US$4.9 billion, or 3 per cent. The personal
loan sector of the Group’s loan portfolio increased to
40 per cent at the end of 2001 compared to 39 per
cent at the end of 2001. Residential mortgage lending
and other personal lending contributed US$6.5
billion and US$3.4 billion respectively to this
growth.
The main change in HSBC’s loan portfolio in
terms of concentration risk related to the expansion
of the personal lending portfolio. In terms of asset
quality, the main change was the substantially
increased risk within the portfolio subsequent to the
collapse in economic conditions in Argentina
following its default on sovereign debt.
There was a decrease in non-performing loans of
US$723 million during 2001 due to a combination of
write-offs and recoveries in Hong Kong and in the
rest of Asia-Pacific, including the recoveries against
a historical Olympia and York exposure. In South
America, there was an increase in the level of non-
performing loans in local currency terms in Brazil
reflecting both targeted growth in consumer lending
and a weaker economy. In Argentina, there was an
increase in non-performing loans during the year due
to the economic deterioration although this was
offset by all fully provided loans being written-off.
As at 31 December 2001, the impact of the economic
crisis had not yet caused individual accounts to
become non-performing against contractual terms.
In terms of non-performing loans, overall credit
quality in North America remained stable in 2001.
Aggregate customer bad and doubtful debt
provisions at 31 December 2001 were in line with 31
December 2000 and at US$8.2 billion represented
2.57 per cent of gross customer advances compared
with 2.73 per cent at 31 December 2000.
During 2001, HSBC’ s cross-border exposures
did not necessitate significant provisions.