HSBC 2002 Annual Report Download - page 141
Download and view the complete annual report
Please find page 141 of the 2002 HSBC annual report below. You can navigate through the pages in the report by either clicking on the pages listed below, or by using the keyword search tool below to find specific information within the annual report.-
 1
1 -
2
-
3
-
4
-
5
-
6
-
7
-
8
-
9
-
10
-
11
-
12
-
13
-
14
-
15
-
16
-
17
-
18
-
19
-
20
-
21
-
22
-
23
-
24
-
25
-
26
-
27
-
28
-
29
-
30
-
31
-
32
-
33
-
34
-
35
-
36
-
37
-
38
-
39
-
40
-
41
-
42
-
43
-
44
-
45
-
46
-
47
-
48
-
49
-
50
-
51
-
52
-
53
-
54
-
55
-
56
-
57
-
58
-
59
-
60
-
61
-
62
-
63
-
64
-
65
-
66
-
67
-
68
-
69
-
70
-
71
-
72
-
73
-
74
-
75
-
76
-
77
-
78
-
79
-
80
-
81
-
82
-
83
-
84
-
85
-
86
-
87
-
88
-
89
-
90
-
91
-
92
-
93
-
94
-
95
-
96
-
97
-
98
-
99
-
100
-
101
-
102
-
103
-
104
-
105
-
106
-
107
-
108
-
109
-
110
-
111
-
112
-
113
-
114
-
115
-
116
-
117
-
118
-
119
-
120
-
121
-
122
-
123
-
124
-
125
-
126
-
127
-
128
-
129
-
130
-
 131
131 -
 132
132 -
 133
133 -
 134
134 -
 135
135 -
 136
136 -
 137
137 -
 138
138 -
 139
139 -
 140
140 -
 141
141 -
 142
142 -
 143
143 -
 144
144 -
 145
145 -
 146
146 -
 147
147 -
 148
148 -
 149
149 -
 150
150 -
 151
151 -
152
-
153
-
154
-
155
-
156
-
157
-
158
-
159
-
160
-
161
-
162
-
163
-
164
-
165
-
166
-
167
-
168
-
169
-
170
-
171
-
172
-
173
-
174
-
175
-
176
-
177
-
178
-
179
-
180
-
181
-
182
-
183
-
184
-
185
-
186
-
187
-
188
-
189
-
190
-
191
-
192
-
193
-
194
-
195
-
196
-
197
-
198
-
199
-
200
-
201
-
202
-
203
-
204
-
205
-
206
-
207
-
208
-
209
-
210
-
211
-
212
-
213
-
214
-
215
-
216
-
217
-
218
-
219
-
220
-
221
-
222
-
223
-
224
-
225
-
226
-
227
-
228
-
229
-
230
-
231
-
232
-
233
-
234
-
235
-
236
-
237
-
238
-
239
-
240
-
241
-
242
-
243
-
244
-
245
-
246
-
247
-
248
-
249
-
250
-
251
-
252
-
253
-
254
-
255
-
256
-
257
-
258
-
259
-
260
-
261
-
262
-
263
-
264
-
265
-
266
-
267
-
268
-
269
-
270
-
271
-
272
-
273
-
274
-
275
-
276
-
277
-
278
-
279
-
280
-
281
-
282
-
283
-
284
-
285
-
286
-
287
-
288
-
289
-
290
-
291
-
292
-
293
-
294
-
295
-
296
-
297
-
298
-
299
-
300
-
301
-
302
-
303
-
304
-
305
-
306
-
307
-
308
-
309
-
310
-
311
-
312
-
313
-
314
-
315
-
316
-
317
-
318
-
319
-
320
-
321
-
322
-
323
-
324
-
325
-
326
-
327
-
328
-
329
 |
 |

139
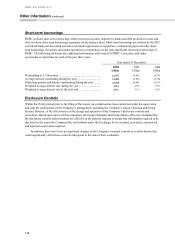
Where considered appropriate, treasury units
and ALCO may use a variety of instruments to
manage interest rate risk, for example to lengthen or
to shorten the duration of the interest risk position.
The range of permitted instruments varies by
location, but is generally restricted to on-balance
sheet financial instruments and plain vanilla interest
rate swaps.
In addition, in the second half of 2002, in
response to the low level of interest rates in the Asian
bloc, ALCO approved the purchase of an interest rate
floor to reduce the effect of further interest rate cuts
to interest margins. The effect of the floor is included
in the sensitivity tables shown below.
Assuming no management action in response to
interest rate movements, an immediate hypothetical
100 basis points parallel fall in all yield curves
worldwide on 1 January 2003 would decrease
planned net interest income for the 12 months to 31
December 2003 by US$690 million while a
hypothetical 100 basis points parallel rise in all yield
curves would decrease planned net interest income
by US$252 million.
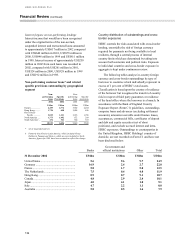
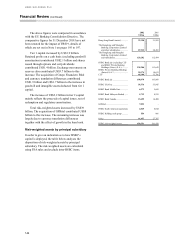
Rather than assuming that all interest rates move
together, HSBC’s interest rate exposures can be
grouped into currency blocs whose interest rates are
considered more likely to move together. The
sensitivity of net interest income for 2003 can then
be described as follows:
Figures in US$ m
US dollar
bloc
Sterling
bloc
Asian
bloc
Latin
American
bloc
Euro
bloc
Total
2003
Total
2002
Change in 2003 projected net interest income
+100 basis points shift in yield curves
–
(
47)
(
225)69
(
49)
(
252)(200)
−100 basis points shift in yield curves
(
243)6
(
437)
(
66)50
(
690)(196)
The change in HSBC’s sensitivity to a fall of
100 basis points is mainly because further interest
rate cuts in the US dollar and Asian blocs at 1
January 2003 would not offer scope to reduce rates
on current and savings accounts by as much as the
full 100 basis points in view of the already low rates
payable on these liabilities, so compressing the
margins on these products.
The projections assume that rates of all
maturities move by the same amount and, therefore,
do not reflect the potential impact on net interest
income of some rates changing while others remain
unchanged. The projections also make other
simplifying assumptions, including an assumption
that all positions run to maturity. In practice, these
exposures are actively managed.
Equities exposure
HSBC’s equities exposure comprises trading
equities, forming the basis of VAR, and long-term
equity investments. The latter are reviewed annually
by the Group Executive Committee and regularly
monitored by the subsidiaries’ ALCOs. VAR on
equities trading positions is set out in the trading
VAR table on page 137.
Operational risk management
Operational risk is the risk of loss arising through
fraud, unauthorised activities, error, omission,
inefficiency, systems failure or from external events.
It is inherent to every business organisation and
covers a wide spectrum of issues.
HSBC manages this risk through a controls-
based environment in which processes are
documented, authorisation is independent and where
transactions are reconciled and monitored. This is
supported by an independent programme of periodic
reviews undertaken by internal audit and internal
peer benchmarking studies which ensure that HSBC
stays in line with best practice and takes account of
lessons learned from publicised operational failures
within the financial services industry. With effect
from the beginning of 2001, operational risk losses
are formally monitored quarterly. In each of HSBC’s
subsidiaries local management is responsible for
establishing an effective and efficient operational
control environment in accordance with HSBC
standards so that HSBC’s assets are adequately
protected, and whereby the operational risks have
been identified and adequate risk management
procedures maintained to control those risks.
HSBC maintains and tests contingency facilities