HSBC 2002 Annual Report Download - page 216
Download and view the complete annual report
Please find page 216 of the 2002 HSBC annual report below. You can navigate through the pages in the report by either clicking on the pages listed below, or by using the keyword search tool below to find specific information within the annual report.-
 1
1 -
2
-
3
-
4
-
5
-
6
-
7
-
8
-
9
-
10
-
11
-
12
-
13
-
14
-
15
-
16
-
17
-
18
-
19
-
20
-
21
-
22
-
23
-
24
-
25
-
26
-
27
-
28
-
29
-
30
-
31
-
32
-
33
-
34
-
35
-
36
-
37
-
38
-
39
-
40
-
41
-
42
-
43
-
44
-
45
-
46
-
47
-
48
-
49
-
50
-
51
-
52
-
53
-
54
-
55
-
56
-
57
-
58
-
59
-
60
-
61
-
62
-
63
-
64
-
65
-
66
-
67
-
68
-
69
-
70
-
71
-
72
-
73
-
74
-
75
-
76
-
77
-
78
-
79
-
80
-
81
-
82
-
83
-
84
-
85
-
86
-
87
-
88
-
89
-
90
-
91
-
92
-
93
-
94
-
95
-
96
-
97
-
98
-
99
-
100
-
101
-
102
-
103
-
104
-
105
-
106
-
107
-
108
-
109
-
110
-
111
-
112
-
113
-
114
-
115
-
116
-
117
-
118
-
119
-
120
-
121
-
122
-
123
-
124
-
125
-
126
-
127
-
128
-
129
-
130
-
131
-
132
-
133
-
134
-
135
-
136
-
137
-
138
-
139
-
140
-
141
-
142
-
143
-
144
-
145
-
146
-
147
-
148
-
149
-
150
-
151
-
152
-
153
-
154
-
155
-
156
-
157
-
158
-
159
-
160
-
161
-
162
-
163
-
164
-
165
-
166
-
167
-
168
-
169
-
170
-
171
-
172
-
173
-
174
-
175
-
176
-
177
-
178
-
179
-
180
-
181
-
182
-
183
-
184
-
185
-
186
-
187
-
188
-
189
-
190
-
191
-
192
-
193
-
194
-
195
-
196
-
197
-
198
-
199
-
200
-
201
-
202
-
203
-
204
-
205
-
 206
206 -
 207
207 -
 208
208 -
 209
209 -
 210
210 -
 211
211 -
 212
212 -
 213
213 -
 214
214 -
 215
215 -
 216
216 -
 217
217 -
 218
218 -
 219
219 -
 220
220 -
 221
221 -
 222
222 -
 223
223 -
 224
224 -
 225
225 -
 226
226 -
227
-
228
-
229
-
230
-
231
-
232
-
233
-
234
-
235
-
236
-
237
-
238
-
239
-
240
-
241
-
242
-
243
-
244
-
245
-
246
-
247
-
248
-
249
-
250
-
251
-
252
-
253
-
254
-
255
-
256
-
257
-
258
-
259
-
260
-
261
-
262
-
263
-
264
-
265
-
266
-
267
-
268
-
269
-
270
-
271
-
272
-
273
-
274
-
275
-
276
-
277
-
278
-
279
-
280
-
281
-
282
-
283
-
284
-
285
-
286
-
287
-
288
-
289
-
290
-
291
-
292
-
293
-
294
-
295
-
296
-
297
-
298
-
299
-
300
-
301
-
302
-
303
-
304
-
305
-
306
-
307
-
308
-
309
-
310
-
311
-
312
-
313
-
314
-
315
-
316
-
317
-
318
-
319
-
320
-
321
-
322
-
323
-
324
-
325
-
326
-
327
-
328
-
329
 |
 |
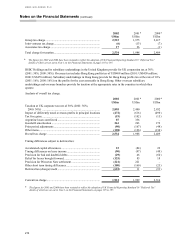
HSBC HOLDINGS PLC
Notes on the Financial Statements (continued)
214
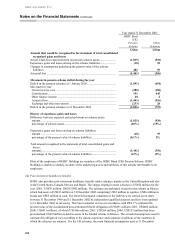
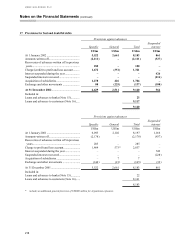
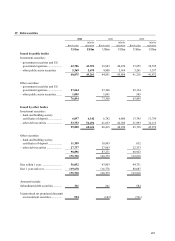
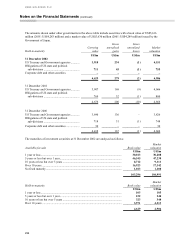
12 Treasury bills and other eligible bills
2002 2001 2000
US$m US$m US$m
Treasury bills and similar securities ............................................. 16,759 17,180 19,373
Other eligible bills........................................................................ 1,382 791 3,758
18,141 17,971 23,131
Of the total treasury and other eligible bills, US$12,902 million (2001: US$12,902 million; 2000:
US$15,862million) are non-trading book items; these are mainly short-term in maturity and are analysed below.
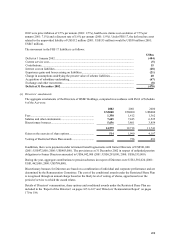
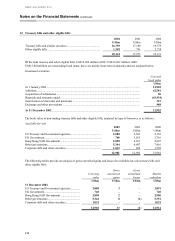
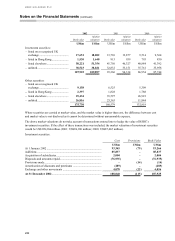
Investment securities:
Cost an
d
book value
US$m
At 1 January 2002................................................................................................................................ 12,902
Additions ............................................................................................................................................. 42,581
Acquisition of subsidiaries................................................................................................................... 50
Disposals and amounts repaid.............................................................................................................. (43,434)
Amortisation of discounts and premiums ............................................................................................ 315
Exchange and other movements .......................................................................................................... 488
At 31 December 2002......................................................................................................................... 12,902
The book value of non-trading treasury bills and other eligible bills, analysed by type of borrower, is as follows:
Available-for-sale
2002 2001 2000
US$m US$m US$m
US Treasury and Government agencies.......................................... 2,888 2,303 2,165
UK Government.............................................................................. 740 3,013 2,716
Hong Kong SAR Government ........................................................ 2,898 2,181 2,007
Other governments.......................................................................... 5,344 4,907 7,416
Corporate debt and other securities................................................. 1,032 498 1,558
12,902 12,902 15,862
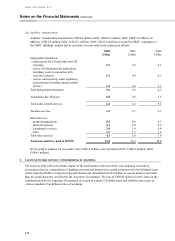
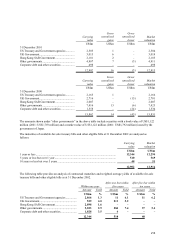
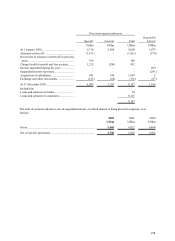
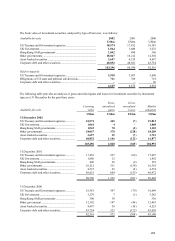
The following tables provide an analysis of gross unrealised gains and losses for available-for-sale treasury bills and
other eligible bills:
Carryin
g
value
Gross
unrealise
d
gains
Gross
unrealise
d
losses Market
valuation
US$m US$m US$m US$m
31 December 2002
US Treasury and Government agencies............. 2,888 3 – 2,891
UK Government................................................. 740
–
– 740
Hong Kong SAR Government ........................... 2,898 2 – 2,900
Other governments............................................. 5,344 8 (1) 5,351
Corporate debt and other securities.................... 1,032
–
–1,032
12,902 13 (1) 12,914