HSBC 2002 Annual Report Download - page 69
Download and view the complete annual report
Please find page 69 of the 2002 HSBC annual report below. You can navigate through the pages in the report by either clicking on the pages listed below, or by using the keyword search tool below to find specific information within the annual report.-
 1
1 -
2
-
3
-
4
-
5
-
6
-
7
-
8
-
9
-
10
-
11
-
12
-
13
-
14
-
15
-
16
-
17
-
18
-
19
-
20
-
21
-
22
-
23
-
24
-
25
-
26
-
27
-
28
-
29
-
30
-
31
-
32
-
33
-
34
-
35
-
36
-
37
-
38
-
39
-
40
-
41
-
42
-
43
-
44
-
45
-
46
-
47
-
48
-
49
-
50
-
51
-
52
-
53
-
54
-
55
-
56
-
57
-
58
-
 59
59 -
 60
60 -
 61
61 -
 62
62 -
 63
63 -
 64
64 -
 65
65 -
 66
66 -
 67
67 -
 68
68 -
 69
69 -
 70
70 -
 71
71 -
 72
72 -
 73
73 -
 74
74 -
 75
75 -
 76
76 -
 77
77 -
 78
78 -
 79
79 -
80
-
81
-
82
-
83
-
84
-
85
-
86
-
87
-
88
-
89
-
90
-
91
-
92
-
93
-
94
-
95
-
96
-
97
-
98
-
99
-
100
-
101
-
102
-
103
-
104
-
105
-
106
-
107
-
108
-
109
-
110
-
111
-
112
-
113
-
114
-
115
-
116
-
117
-
118
-
119
-
120
-
121
-
122
-
123
-
124
-
125
-
126
-
127
-
128
-
129
-
130
-
131
-
132
-
133
-
134
-
135
-
136
-
137
-
138
-
139
-
140
-
141
-
142
-
143
-
144
-
145
-
146
-
147
-
148
-
149
-
150
-
151
-
152
-
153
-
154
-
155
-
156
-
157
-
158
-
159
-
160
-
161
-
162
-
163
-
164
-
165
-
166
-
167
-
168
-
169
-
170
-
171
-
172
-
173
-
174
-
175
-
176
-
177
-
178
-
179
-
180
-
181
-
182
-
183
-
184
-
185
-
186
-
187
-
188
-
189
-
190
-
191
-
192
-
193
-
194
-
195
-
196
-
197
-
198
-
199
-
200
-
201
-
202
-
203
-
204
-
205
-
206
-
207
-
208
-
209
-
210
-
211
-
212
-
213
-
214
-
215
-
216
-
217
-
218
-
219
-
220
-
221
-
222
-
223
-
224
-
225
-
226
-
227
-
228
-
229
-
230
-
231
-
232
-
233
-
234
-
235
-
236
-
237
-
238
-
239
-
240
-
241
-
242
-
243
-
244
-
245
-
246
-
247
-
248
-
249
-
250
-
251
-
252
-
253
-
254
-
255
-
256
-
257
-
258
-
259
-
260
-
261
-
262
-
263
-
264
-
265
-
266
-
267
-
268
-
269
-
270
-
271
-
272
-
273
-
274
-
275
-
276
-
277
-
278
-
279
-
280
-
281
-
282
-
283
-
284
-
285
-
286
-
287
-
288
-
289
-
290
-
291
-
292
-
293
-
294
-
295
-
296
-
297
-
298
-
299
-
300
-
301
-
302
-
303
-
304
-
305
-
306
-
307
-
308
-
309
-
310
-
311
-
312
-
313
-
314
-
315
-
316
-
317
-
318
-
319
-
320
-
321
-
322
-
323
-
324
-
325
-
326
-
327
-
328
-
329
 |
 |
67
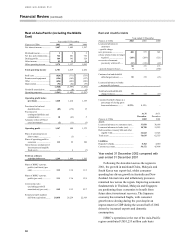
operating profit before provisions, an increase of
3 per cent compared with 2001. In constant currency
terms the growth was 2 per cent. Cash basis profit
before tax of US$1,293 million was 18 per cent
higher than 2001. The increase in profit before tax
resulted largely from lower bad debt charges,
particularly in the Middle East and Indonesia.
Net interest income of US$1,607 million was
US$125 million, or 8 per cent, higher than in 2001.
The increase was driven by strong growth in credit
card and personal lending across the region,
particularly in Taiwan, Singapore, India, the
Philippines and Australia, the latter supported by
HSBC’s acquisition of NRMA Building Society in
2001. Overall, average loans and advances to
customers in the rest of Asia-Pacific increased by 14
per cent compared with 2001.
Other operating income increased by US$37
million, or 3 per cent, compared with 2001. Net fee
income increased by US$43 million, or 6 per cent,
compared with 2001. There was a 30 per cent
increase in credit card income, mainly focused in
Taiwan, Malaysia, Indonesia and the Middle East.
There was also good growth in account service and
credit-related fee income. Dealing profits fell by
US$31 million, or 8 per cent, to US$364 million.
The reduction resulted principally from lower
interest rate derivatives and debt securities trading
income in Singapore and the Philippines.
Total operating expenses excluding goodwill
increased by US$131 million, or 9 per cent, to
US$1,528 million. This included an increase of
US$26 million resulting from the further expansion
of HSBC’s processing facilities in mainland China
and India, along with significant business expansion,
particularly in the Middle East and Taiwan. In
addition, an increase in costs in Australia resulted
from the acquisition of NRMA Building Society at
the end of 2001. Staff costs increased by US$55
million, or 7 per cent, to US$826 million. Of the
increase, US$13 million relates to the processing
centres in India and mainland China. There was also
a significant increase in staff costs in the Middle East
as a result of increased headcount to support the
expansion of personal and commercial banking.
This was offset by savings in Singapore due to lower
headcount and lower levels of voluntary severance
costs. Other administrative expenses increased by
US$76 million, particularly due to the expansion of
personal financial services in Taiwan, Singapore and
mainland China, one-off IT costs in the Middle East,
and higher costs in Australia arising from the
acquisition of NRMA Building Society in 2001.
The charge for bad and doubtful debts of US$89
million was US$83 million lower than in 2001.
There was a significant reduction in the bad debt
charges in Indonesia, the Middle East and mainland
China. In Indonesia, there were significantly lower
new provisions raised, particularly against
commercial and corporate sectors, along with higher
levels of releases against commercial and corporate
customers. Strengthened credit control procedures in
the Middle East led to lower requirements for new
specific provisions against both personal and
corporate customers, along with releases in the UAE
and Lebanon. In mainland China, there were various
recoveries of provisions against corporate customers.
HSBC’s operations in Singapore reported an
increase in operating profit before provisions of
US$22 million, or 12 per cent to US$213 million.
Profit before tax fell by 17 per cent to US$223
million, as 2001 benefited from the release of
provisions held against the historic Olympia and
York exposure. Net interest income increased by
US$20 million, or 8 per cent, to US$272 million
driven mainly by increased volumes of car loans and
a strong treasury performance, partly offset by
narrower spreads and subdued demand in the
commercial and corporate sector. Dealing profits fell
by US$17 million, or 29 per cent, due to lower
profits from interest rate derivatives and debt
securities trading resulting from interest rate
movements and wider credit spreads. Fee income
remained flat with growth in income from the sale of
HSBC’s capital guaranteed funds offset by
reductions in broking income. Operating expenses
fell by US$16 million, or 7 per cent to US$204
million. Staff costs fell by US$24 million, or 17 per
cent as a result of lower headcount and lower
voluntary separation costs. Other administrative
expenses increased by US$8 million including higher
marketing costs relating to personal financial
services. There was a net release of US$6 million of
bad debts, compared with a net release of US$94
million in 2001 which benefited from the recovery
made against the historic Olympia and York
exposure. New provisions were US$22 million lower
than in 2001, particularly relating to exposures in the
corporate sector, and there were further recoveries
from commercial and corporate customers.
HSBC’s operations in India reported operating
profit before provisions of US$111 million, an