HSBC 2002 Annual Report Download - page 133
Download and view the complete annual report
Please find page 133 of the 2002 HSBC annual report below. You can navigate through the pages in the report by either clicking on the pages listed below, or by using the keyword search tool below to find specific information within the annual report.-
 1
1 -
2
-
3
-
4
-
5
-
6
-
7
-
8
-
9
-
10
-
11
-
12
-
13
-
14
-
15
-
16
-
17
-
18
-
19
-
20
-
21
-
22
-
23
-
24
-
25
-
26
-
27
-
28
-
29
-
30
-
31
-
32
-
33
-
34
-
35
-
36
-
37
-
38
-
39
-
40
-
41
-
42
-
43
-
44
-
45
-
46
-
47
-
48
-
49
-
50
-
51
-
52
-
53
-
54
-
55
-
56
-
57
-
58
-
59
-
60
-
61
-
62
-
63
-
64
-
65
-
66
-
67
-
68
-
69
-
70
-
71
-
72
-
73
-
74
-
75
-
76
-
77
-
78
-
79
-
80
-
81
-
82
-
83
-
84
-
85
-
86
-
87
-
88
-
89
-
90
-
91
-
92
-
93
-
94
-
95
-
96
-
97
-
98
-
99
-
100
-
101
-
102
-
103
-
104
-
105
-
106
-
107
-
108
-
109
-
110
-
111
-
112
-
113
-
114
-
115
-
116
-
117
-
118
-
119
-
120
-
121
-
122
-
 123
123 -
 124
124 -
 125
125 -
 126
126 -
 127
127 -
 128
128 -
 129
129 -
 130
130 -
 131
131 -
 132
132 -
 133
133 -
 134
134 -
 135
135 -
 136
136 -
 137
137 -
 138
138 -
 139
139 -
 140
140 -
 141
141 -
 142
142 -
 143
143 -
144
-
145
-
146
-
147
-
148
-
149
-
150
-
151
-
152
-
153
-
154
-
155
-
156
-
157
-
158
-
159
-
160
-
161
-
162
-
163
-
164
-
165
-
166
-
167
-
168
-
169
-
170
-
171
-
172
-
173
-
174
-
175
-
176
-
177
-
178
-
179
-
180
-
181
-
182
-
183
-
184
-
185
-
186
-
187
-
188
-
189
-
190
-
191
-
192
-
193
-
194
-
195
-
196
-
197
-
198
-
199
-
200
-
201
-
202
-
203
-
204
-
205
-
206
-
207
-
208
-
209
-
210
-
211
-
212
-
213
-
214
-
215
-
216
-
217
-
218
-
219
-
220
-
221
-
222
-
223
-
224
-
225
-
226
-
227
-
228
-
229
-
230
-
231
-
232
-
233
-
234
-
235
-
236
-
237
-
238
-
239
-
240
-
241
-
242
-
243
-
244
-
245
-
246
-
247
-
248
-
249
-
250
-
251
-
252
-
253
-
254
-
255
-
256
-
257
-
258
-
259
-
260
-
261
-
262
-
263
-
264
-
265
-
266
-
267
-
268
-
269
-
270
-
271
-
272
-
273
-
274
-
275
-
276
-
277
-
278
-
279
-
280
-
281
-
282
-
283
-
284
-
285
-
286
-
287
-
288
-
289
-
290
-
291
-
292
-
293
-
294
-
295
-
296
-
297
-
298
-
299
-
300
-
301
-
302
-
303
-
304
-
305
-
306
-
307
-
308
-
309
-
310
-
311
-
312
-
313
-
314
-
315
-
316
-
317
-
318
-
319
-
320
-
321
-
322
-
323
-
324
-
325
-
326
-
327
-
328
-
329
 |
 |

131
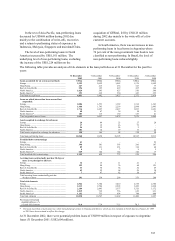
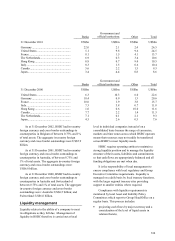
In the rest of Asia-Pacific, non-performing loans
decreased by US$668 million during 2002 due
mainly to the combination of write-offs, recoveries
and a return to performing status of exposures in
Indonesia, Malaysia, Singapore and mainland China.
The level of non-performing loans in North
America increased by US$1,101 million. The
underlying level of non-performing loans, excluding
the increase of the US$1,224 million on the
acquisition of GFBital, fell by US$123 million
during 2002 due mainly to the write-offs of a few
customer accounts.
In South America, there was an increase in non-
performing loans in local terms in Argentina where
74 per cent of the non-government loan book is now
classified as non-performing. In Brazil, the level of
non-performing loans reduced slightly.
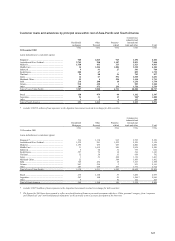
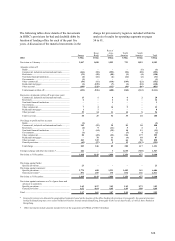
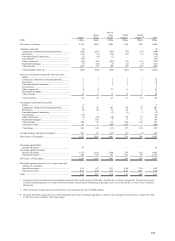
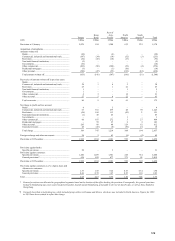
The following table provides an analysis of risk elements in the loan portfolios as at 31 December for the past five
years:
31 December
2002
31 Decembe
r
2001
31 Decembe
r
2000
31 Decembe
r
1999
31 Decembe
r
1998
Loans accounted for on a non-accrual basis: US$m US$
m
US$
m
US$
m
US$
m
Europe........................................................................ 2,393 2,052 1,985 1,176 1,092
Hong Kong................................................................. 247 213 236 163 77
Rest of Asia-Pacific.................................................... 294 195 429 435 344
North America............................................................ 1,624 593 627 550 546
South America*.......................................................... 293 429 550 447 355
Total non-accrual loans .............................................. 4,851 3,482 3,827 2,771 2,414
Loans on which interest has been accrued but
suspended:
Europe........................................................................ 2,086 1,553 1,389 1,514 1,243
Hong Kong................................................................. 1,460 1,795 2,259 2,898 2,443
Rest of Asia-Pacific.................................................... 1,714 2,497 2,627 3,097 2,691
North America............................................................ 48 67 39 34 31
South America*.......................................................... 183 115 160 133 41
Total suspended interest loans .................................... 5,491 6,027 6,474 7,676 6,449
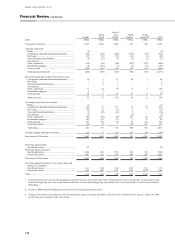
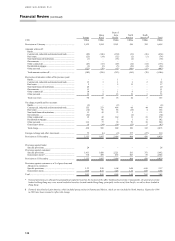
Assets acquired in exchange for advances:
Europe........................................................................ 26 84 25 27 28
Hong Kong................................................................. 17 19 26 72
–
Rest of Asia-Pacific.................................................... 54 32 24 2
–
North America............................................................ 101 14 19 17 22
Total assets acquired in exchange for advances .......... 198 149 94 118 50
Total non-performing loans ........................................ 10,540 9,658 10,395 10,565 8,913
Troubled debt restructurings:
Europe........................................................................ 41
–
–
–
22
Hong Kong................................................................. 396 381 395 266 187
Rest of Asia-Pacific ................................................... 89 131 231 138 68
North America............................................................ 437 92
South America*.......................................................... 669 144 142 146 17
Total troubled debt restructurings............................... 1,199 659 775 559 296
Accruing loans contractually past due 90 days or
more as to principal or interest:
Europe........................................................................ 16 15 11 21 1
Hong Kong................................................................. 193 98 76 84 121
Rest of Asia-Pacific.................................................... 33 38 66 54 69
North America ........................................................... 42 52 64 59 30
South America*.......................................................... 747 82 58 67
Total accruing loans contractually past due
90 days or more .................................................... 291 250 299 276 288
Total risk elements:
Europe........................................................................ 4,562 3,704 3,410 2,738 2,386
Hong Kong................................................................. 2,313 2,506 2,992 3,483 2,828
Rest of Asia-Pacific.................................................... 2,184 2,893 3,377 3,726 3,172
North America............................................................ 1,819 729 756 669 631
South America*.......................................................... 1,152 735 934 784 480
Total risk elements ..................................................... 12,030 10,567 11,469 11,400 9,497
Provisions for bad and
doubtful debts as a %
of total risk elements .............................................. 76.0 77.4 71.5 70.3 70.1
* Formerly described as Latin America, which included group entities in Panama and Mexico, which are now included in North America. Figures for 1998
to 2001 have been restated to reflect this change.
At 31 December 2002, there were potential problem loans of US$599 million in respect of exposure to Argentine
loans (31 December 2001: US$2,604 million).