HSBC 2002 Annual Report Download - page 269
Download and view the complete annual report
Please find page 269 of the 2002 HSBC annual report below. You can navigate through the pages in the report by either clicking on the pages listed below, or by using the keyword search tool below to find specific information within the annual report.-
 1
1 -
2
-
3
-
4
-
5
-
6
-
7
-
8
-
9
-
10
-
11
-
12
-
13
-
14
-
15
-
16
-
17
-
18
-
19
-
20
-
21
-
22
-
23
-
24
-
25
-
26
-
27
-
28
-
29
-
30
-
31
-
32
-
33
-
34
-
35
-
36
-
37
-
38
-
39
-
40
-
41
-
42
-
43
-
44
-
45
-
46
-
47
-
48
-
49
-
50
-
51
-
52
-
53
-
54
-
55
-
56
-
57
-
58
-
59
-
60
-
61
-
62
-
63
-
64
-
65
-
66
-
67
-
68
-
69
-
70
-
71
-
72
-
73
-
74
-
75
-
76
-
77
-
78
-
79
-
80
-
81
-
82
-
83
-
84
-
85
-
86
-
87
-
88
-
89
-
90
-
91
-
92
-
93
-
94
-
95
-
96
-
97
-
98
-
99
-
100
-
101
-
102
-
103
-
104
-
105
-
106
-
107
-
108
-
109
-
110
-
111
-
112
-
113
-
114
-
115
-
116
-
117
-
118
-
119
-
120
-
121
-
122
-
123
-
124
-
125
-
126
-
127
-
128
-
129
-
130
-
131
-
132
-
133
-
134
-
135
-
136
-
137
-
138
-
139
-
140
-
141
-
142
-
143
-
144
-
145
-
146
-
147
-
148
-
149
-
150
-
151
-
152
-
153
-
154
-
155
-
156
-
157
-
158
-
159
-
160
-
161
-
162
-
163
-
164
-
165
-
166
-
167
-
168
-
169
-
170
-
171
-
172
-
173
-
174
-
175
-
176
-
177
-
178
-
179
-
180
-
181
-
182
-
183
-
184
-
185
-
186
-
187
-
188
-
189
-
190
-
191
-
192
-
193
-
194
-
195
-
196
-
197
-
198
-
199
-
200
-
201
-
202
-
203
-
204
-
205
-
206
-
207
-
208
-
209
-
210
-
211
-
212
-
213
-
214
-
215
-
216
-
217
-
218
-
219
-
220
-
221
-
222
-
223
-
224
-
225
-
226
-
227
-
228
-
229
-
230
-
231
-
232
-
233
-
234
-
235
-
236
-
237
-
238
-
239
-
240
-
241
-
242
-
243
-
244
-
245
-
246
-
247
-
248
-
249
-
250
-
251
-
252
-
253
-
254
-
255
-
256
-
257
-
258
-
 259
259 -
 260
260 -
 261
261 -
 262
262 -
 263
263 -
 264
264 -
 265
265 -
 266
266 -
 267
267 -
 268
268 -
 269
269 -
 270
270 -
 271
271 -
 272
272 -
 273
273 -
 274
274 -
 275
275 -
 276
276 -
 277
277 -
 278
278 -
 279
279 -
280
-
281
-
282
-
283
-
284
-
285
-
286
-
287
-
288
-
289
-
290
-
291
-
292
-
293
-
294
-
295
-
296
-
297
-
298
-
299
-
300
-
301
-
302
-
303
-
304
-
305
-
306
-
307
-
308
-
309
-
310
-
311
-
312
-
313
-
314
-
315
-
316
-
317
-
318
-
319
-
320
-
321
-
322
-
323
-
324
-
325
-
326
-
327
-
328
-
329
 |
 |

267
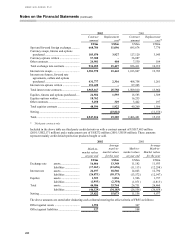
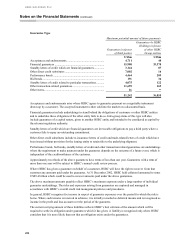
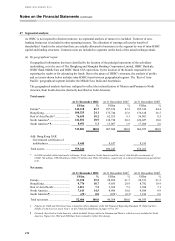
At 31 December 2002, HSBC had established the following provisions in respect of its obligations under
outstanding guarantees:
US$m
Acceptances and endorsements....................................................................................................... 37
Guarantees and items pledged as collateral security....................................................................... 106
Other items...................................................................................................................................... 32
HSBC believes that the fair value of its liabilities under other guarantees for which no provision has been
established is equal to the amount of deferred income received but not yet recognised for such guarantees.
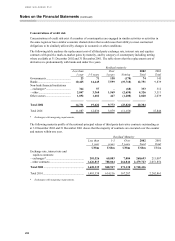
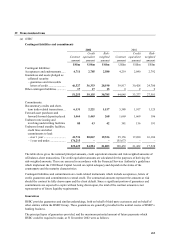
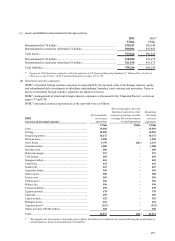
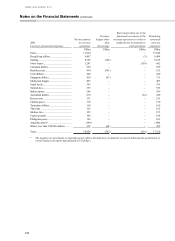
(b) Concentration of contingent liabilities and commitments
HSBC has the following concentrations of exposure to contingent liabilities and commitments and these are
determined on the basis set out in Note 47:
Contract amounts
Europe
H
ong Kon
g
R
est o
f
Asia-Pacific North
America South
America*Tota
l
US$m US$m US$m US$m US$m US$m
Contingent liabilities
2002 .................................... 23,697 12,886 6,550 7,680 442 51,255
2001 .................................... 20,763 9,260 5,576 7,912 534 44,045
Commitments
2002 .................................... 89,569 56,810 30,743 45,484 3,023 225,629
2001 .................................... 72,397 50,743 26,191 46,160 2,968 198,459
*Formerly described as Latin America, which included Group entities in Panama and Mexico, which are now included in North
America. Figures for 2001 have been restated to reflect this change.
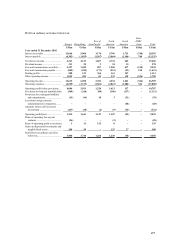
40 Market risk management
HSBC’ s market risk management process is discussed in the ‘Financial Review’ section on pages 135 to 139 from
the paragraph under the heading ‘Market risk management’ to the paragraph ended ‘impact of extreme events on the
market risk exposures of HSBC’ .
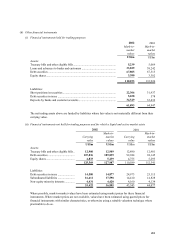
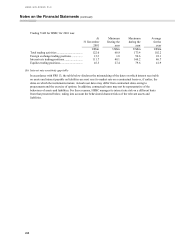
(a) Trading VAR
VAR is a technique that estimates the potential losses that could occur on risk positions taken due to movements
in market rates and prices over a specified time horizon and to a given level of confidence.
Trading VAR for HSBC for 2002 was:
At Minimum Maximum Average
31 December During the during the for the
2002 year year year
US$m US$m US$m US$m
Total trading activities ................................... 71.6 66.7 130.0 93.9
Foreign exchange trading positions ............... 12.9 2.4 47.0 21.0
Interest rate trading positions......................... 63.2 60.2 120.9 82.4
Equities trading positions............................... 27.1 20.4 40.6 29.0