HSBC 2002 Annual Report Download - page 208
Download and view the complete annual report
Please find page 208 of the 2002 HSBC annual report below. You can navigate through the pages in the report by either clicking on the pages listed below, or by using the keyword search tool below to find specific information within the annual report.-
 1
1 -
2
-
3
-
4
-
5
-
6
-
7
-
8
-
9
-
10
-
11
-
12
-
13
-
14
-
15
-
16
-
17
-
18
-
19
-
20
-
21
-
22
-
23
-
24
-
25
-
26
-
27
-
28
-
29
-
30
-
31
-
32
-
33
-
34
-
35
-
36
-
37
-
38
-
39
-
40
-
41
-
42
-
43
-
44
-
45
-
46
-
47
-
48
-
49
-
50
-
51
-
52
-
53
-
54
-
55
-
56
-
57
-
58
-
59
-
60
-
61
-
62
-
63
-
64
-
65
-
66
-
67
-
68
-
69
-
70
-
71
-
72
-
73
-
74
-
75
-
76
-
77
-
78
-
79
-
80
-
81
-
82
-
83
-
84
-
85
-
86
-
87
-
88
-
89
-
90
-
91
-
92
-
93
-
94
-
95
-
96
-
97
-
98
-
99
-
100
-
101
-
102
-
103
-
104
-
105
-
106
-
107
-
108
-
109
-
110
-
111
-
112
-
113
-
114
-
115
-
116
-
117
-
118
-
119
-
120
-
121
-
122
-
123
-
124
-
125
-
126
-
127
-
128
-
129
-
130
-
131
-
132
-
133
-
134
-
135
-
136
-
137
-
138
-
139
-
140
-
141
-
142
-
143
-
144
-
145
-
146
-
147
-
148
-
149
-
150
-
151
-
152
-
153
-
154
-
155
-
156
-
157
-
158
-
159
-
160
-
161
-
162
-
163
-
164
-
165
-
166
-
167
-
168
-
169
-
170
-
171
-
172
-
173
-
174
-
175
-
176
-
177
-
178
-
179
-
180
-
181
-
182
-
183
-
184
-
185
-
186
-
187
-
188
-
189
-
190
-
191
-
192
-
193
-
194
-
195
-
196
-
197
-
 198
198 -
 199
199 -
 200
200 -
 201
201 -
 202
202 -
 203
203 -
 204
204 -
 205
205 -
 206
206 -
 207
207 -
 208
208 -
 209
209 -
 210
210 -
 211
211 -
 212
212 -
 213
213 -
 214
214 -
 215
215 -
 216
216 -
 217
217 -
 218
218 -
219
-
220
-
221
-
222
-
223
-
224
-
225
-
226
-
227
-
228
-
229
-
230
-
231
-
232
-
233
-
234
-
235
-
236
-
237
-
238
-
239
-
240
-
241
-
242
-
243
-
244
-
245
-
246
-
247
-
248
-
249
-
250
-
251
-
252
-
253
-
254
-
255
-
256
-
257
-
258
-
259
-
260
-
261
-
262
-
263
-
264
-
265
-
266
-
267
-
268
-
269
-
270
-
271
-
272
-
273
-
274
-
275
-
276
-
277
-
278
-
279
-
280
-
281
-
282
-
283
-
284
-
285
-
286
-
287
-
288
-
289
-
290
-
291
-
292
-
293
-
294
-
295
-
296
-
297
-
298
-
299
-
300
-
301
-
302
-
303
-
304
-
305
-
306
-
307
-
308
-
309
-
310
-
311
-
312
-
313
-
314
-
315
-
316
-
317
-
318
-
319
-
320
-
321
-
322
-
323
-
324
-
325
-
326
-
327
-
328
-
329
 |
 |

HSBC HOLDINGS PLC
Notes on the Financial Statements (continued)
206
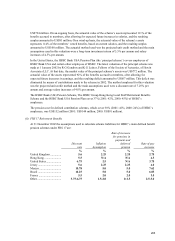
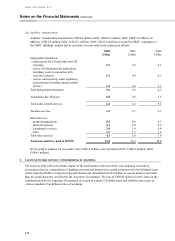
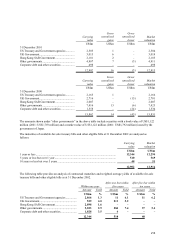
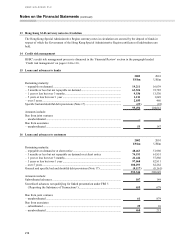
At 31 December 2001 the assumptions used to calculate scheme liabilities for HSBC’ s main defined benefit
pension schemes under FRS 17 were:
D
iscoun
t
rate Inflation
Assumption
Rate of increase
for pensions in
p
ayment an
d
deferre
d
pension Rate of pay
increase
%%%%
United Kingdom..................... 5.9 2.5 2.5 3.75
Hong Kong............................. 6.5 N/A N/A 6.0
United States .......................... 7.25 2.75 N/A 4.0
Jersey...................................... 5.9 2.5 2.5 4.25
Brazil...................................... 10.25 5.0 5.0 6.05
France..................................... 5.5 2.0 2.0 3.5
Other ...................................... 4.5-6.25 1.5-2.0 1.5-2.0 2.5-3.5
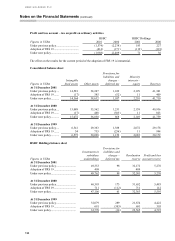
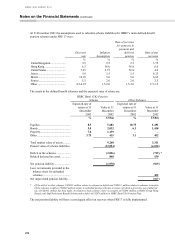
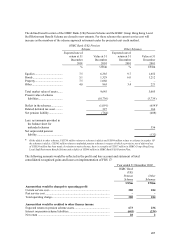
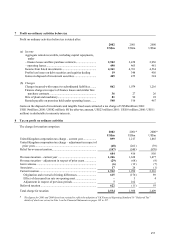
The assets in the defined benefit schemes and the expected rates of return are:
HSBC Bank (UK) Pension
Scheme Other Schemes
Expected rate o
f
return at 31
December
2002
Value at 31
December
2002
Expected rate o
f
return at 31
December
2002
Value at 31
December
2002
%US$m %US$m
Equities .......................................... 8.5 5,682 10.75 1,491
Bonds............................................. 5.0 2,032 6.3 1,418
Property.......................................... 7.0 1,139
–
–
Other .............................................. 3.75 415 3.1 402
Total market value of assets........... 9,268 3,311
Present value of scheme liabilities . (12,094) (4,030)
Deficit in the schemes.................... (2,826) (719) *
Related deferred tax asset .............. 848 150
Net pension liability....................... (1,978) (569)
Less: net amounts provided in the
balance sheet for unfunded
schemes ...................................... 402
Net unprovided pension liability.... (167)
* Of the deficit in other schemes, US$832 million relates to schemes in deficit and US$113 million relates to schemes in surplus.
Of the schemes in deficit, US$442 million relates to unfunded pension schemes in respect of which a provision, net of deferred
tax, of US$402 million has been made. In relation to main schemes, there is a surplus of US$86 million in HSBC Group Hong
Kong Local Staff Retirement Benefit Scheme and a deficit of US$79 million in HSBC Bank USA Pension Plan.
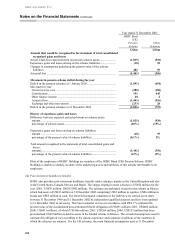
The net pension liability will have a consequent effect on reserves when FRS17 is fully implemented.