HSBC 2002 Annual Report Download - page 282
Download and view the complete annual report
Please find page 282 of the 2002 HSBC annual report below. You can navigate through the pages in the report by either clicking on the pages listed below, or by using the keyword search tool below to find specific information within the annual report.-
 1
1 -
2
-
3
-
4
-
5
-
6
-
7
-
8
-
9
-
10
-
11
-
12
-
13
-
14
-
15
-
16
-
17
-
18
-
19
-
20
-
21
-
22
-
23
-
24
-
25
-
26
-
27
-
28
-
29
-
30
-
31
-
32
-
33
-
34
-
35
-
36
-
37
-
38
-
39
-
40
-
41
-
42
-
43
-
44
-
45
-
46
-
47
-
48
-
49
-
50
-
51
-
52
-
53
-
54
-
55
-
56
-
57
-
58
-
59
-
60
-
61
-
62
-
63
-
64
-
65
-
66
-
67
-
68
-
69
-
70
-
71
-
72
-
73
-
74
-
75
-
76
-
77
-
78
-
79
-
80
-
81
-
82
-
83
-
84
-
85
-
86
-
87
-
88
-
89
-
90
-
91
-
92
-
93
-
94
-
95
-
96
-
97
-
98
-
99
-
100
-
101
-
102
-
103
-
104
-
105
-
106
-
107
-
108
-
109
-
110
-
111
-
112
-
113
-
114
-
115
-
116
-
117
-
118
-
119
-
120
-
121
-
122
-
123
-
124
-
125
-
126
-
127
-
128
-
129
-
130
-
131
-
132
-
133
-
134
-
135
-
136
-
137
-
138
-
139
-
140
-
141
-
142
-
143
-
144
-
145
-
146
-
147
-
148
-
149
-
150
-
151
-
152
-
153
-
154
-
155
-
156
-
157
-
158
-
159
-
160
-
161
-
162
-
163
-
164
-
165
-
166
-
167
-
168
-
169
-
170
-
171
-
172
-
173
-
174
-
175
-
176
-
177
-
178
-
179
-
180
-
181
-
182
-
183
-
184
-
185
-
186
-
187
-
188
-
189
-
190
-
191
-
192
-
193
-
194
-
195
-
196
-
197
-
198
-
199
-
200
-
201
-
202
-
203
-
204
-
205
-
206
-
207
-
208
-
209
-
210
-
211
-
212
-
213
-
214
-
215
-
216
-
217
-
218
-
219
-
220
-
221
-
222
-
223
-
224
-
225
-
226
-
227
-
228
-
229
-
230
-
231
-
232
-
233
-
234
-
235
-
236
-
237
-
238
-
239
-
240
-
241
-
242
-
243
-
244
-
245
-
246
-
247
-
248
-
249
-
250
-
251
-
252
-
253
-
254
-
255
-
256
-
257
-
258
-
259
-
260
-
261
-
262
-
263
-
264
-
265
-
266
-
267
-
268
-
269
-
270
-
271
-
 272
272 -
 273
273 -
 274
274 -
 275
275 -
 276
276 -
 277
277 -
 278
278 -
 279
279 -
 280
280 -
 281
281 -
 282
282 -
 283
283 -
 284
284 -
 285
285 -
 286
286 -
 287
287 -
 288
288 -
 289
289 -
 290
290 -
 291
291 -
 292
292 -
293
-
294
-
295
-
296
-
297
-
298
-
299
-
300
-
301
-
302
-
303
-
304
-
305
-
306
-
307
-
308
-
309
-
310
-
311
-
312
-
313
-
314
-
315
-
316
-
317
-
318
-
319
-
320
-
321
-
322
-
323
-
324
-
325
-
326
-
327
-
328
-
329
 |
 |

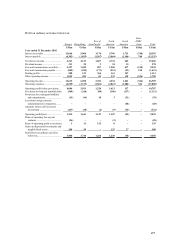
HSBC HOLDINGS PLC
Notes on the Financial Statements (continued)
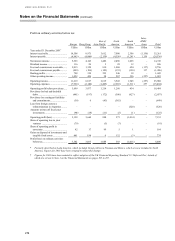
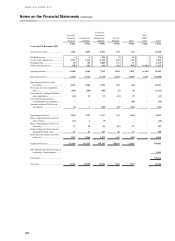
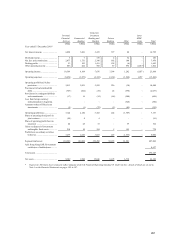
280
Personal
Financial
Services Commercial
Banking
Corporate,
Investment
Banking and
Markets Private
Banking Other
Intra-
HSBC
items Total
US$m US$m US$m US$m US$m US$m US$m
Year ended 31 December 2002
Net interest income............................ 7,581 3,855 3,521 556 (53) – 15,460
Dividend income ............................... 6 6 230 2 34 – 278
Net fees and commissions.................. 2,979 1,934 2,164 623 124 – 7,824
Dealing profits................................... 50 107 1,008 137 11 – 1,313
Other operating income ..................... 788 463 610 102 905 (1,148 ) 1,720
Operating income .............................. 11,404 6,365 7,533 1,420 1,021 (1,148) 26,595
Operating expenses............................ (7,159 ) (3,321) (4,135) (1,251 ) (1,090) 1,148 (15,808 )
Operating profit/(loss) before
provisions ..................................... 4,245 3,044 3,398 169 (69) – 10,787
Provisions for bad and doubtful
debts ............................................. (857 ) (269) (184) (5 ) (6 ) – (1,321 )
Provisions for contingent liabilities
and commitments.......................... (42 ) 19 12 (21 ) (7 ) – (39 )
Loss from foreign currency
redenomination in Argentina......... ––––(68)–(68)
Amounts written off fixed asset
investments ................................... (2 ) 3 (109 ) (22 ) (194 ) – (324 )
Operating profit/(loss) ....................... 3,344 2,797 3,117 121 (344 ) – 9,035
Share of operating (loss)/profit in
joint ventures ................................ (23) 2 (7 ) – – – (28 )
Share of operating profit/(loss) in
associates ...................................... 17 16 46 (11) 67 – 135
Gains on disposal of investments
and tangible fixed assets ............... 19 51 317 46 75 – 508
Profit/(loss) on ordinary activities
before tax...................................... 3,357 2,866 3,473 156 (202) – 9,650
Segment total assets........................... 171,496 113,525 394,542 48,346 21,892 749,801
Add: Hong Kong SAR Government
certificates of indebtedness ........... 9,445
Total assets........................................ 759,246
Net assets........................................... 12,101 10,290 16,852 7,366 5,797 52,406