HSBC 2002 Annual Report Download - page 144
Download and view the complete annual report
Please find page 144 of the 2002 HSBC annual report below. You can navigate through the pages in the report by either clicking on the pages listed below, or by using the keyword search tool below to find specific information within the annual report.-
 1
1 -
2
-
3
-
4
-
5
-
6
-
7
-
8
-
9
-
10
-
11
-
12
-
13
-
14
-
15
-
16
-
17
-
18
-
19
-
20
-
21
-
22
-
23
-
24
-
25
-
26
-
27
-
28
-
29
-
30
-
31
-
32
-
33
-
34
-
35
-
36
-
37
-
38
-
39
-
40
-
41
-
42
-
43
-
44
-
45
-
46
-
47
-
48
-
49
-
50
-
51
-
52
-
53
-
54
-
55
-
56
-
57
-
58
-
59
-
60
-
61
-
62
-
63
-
64
-
65
-
66
-
67
-
68
-
69
-
70
-
71
-
72
-
73
-
74
-
75
-
76
-
77
-
78
-
79
-
80
-
81
-
82
-
83
-
84
-
85
-
86
-
87
-
88
-
89
-
90
-
91
-
92
-
93
-
94
-
95
-
96
-
97
-
98
-
99
-
100
-
101
-
102
-
103
-
104
-
105
-
106
-
107
-
108
-
109
-
110
-
111
-
112
-
113
-
114
-
115
-
116
-
117
-
118
-
119
-
120
-
121
-
122
-
123
-
124
-
125
-
126
-
127
-
128
-
129
-
130
-
131
-
132
-
133
-
 134
134 -
 135
135 -
 136
136 -
 137
137 -
 138
138 -
 139
139 -
 140
140 -
 141
141 -
 142
142 -
 143
143 -
 144
144 -
 145
145 -
 146
146 -
 147
147 -
 148
148 -
 149
149 -
 150
150 -
 151
151 -
 152
152 -
 153
153 -
 154
154 -
155
-
156
-
157
-
158
-
159
-
160
-
161
-
162
-
163
-
164
-
165
-
166
-
167
-
168
-
169
-
170
-
171
-
172
-
173
-
174
-
175
-
176
-
177
-
178
-
179
-
180
-
181
-
182
-
183
-
184
-
185
-
186
-
187
-
188
-
189
-
190
-
191
-
192
-
193
-
194
-
195
-
196
-
197
-
198
-
199
-
200
-
201
-
202
-
203
-
204
-
205
-
206
-
207
-
208
-
209
-
210
-
211
-
212
-
213
-
214
-
215
-
216
-
217
-
218
-
219
-
220
-
221
-
222
-
223
-
224
-
225
-
226
-
227
-
228
-
229
-
230
-
231
-
232
-
233
-
234
-
235
-
236
-
237
-
238
-
239
-
240
-
241
-
242
-
243
-
244
-
245
-
246
-
247
-
248
-
249
-
250
-
251
-
252
-
253
-
254
-
255
-
256
-
257
-
258
-
259
-
260
-
261
-
262
-
263
-
264
-
265
-
266
-
267
-
268
-
269
-
270
-
271
-
272
-
273
-
274
-
275
-
276
-
277
-
278
-
279
-
280
-
281
-
282
-
283
-
284
-
285
-
286
-
287
-
288
-
289
-
290
-
291
-
292
-
293
-
294
-
295
-
296
-
297
-
298
-
299
-
300
-
301
-
302
-
303
-
304
-
305
-
306
-
307
-
308
-
309
-
310
-
311
-
312
-
313
-
314
-
315
-
316
-
317
-
318
-
319
-
320
-
321
-
322
-
323
-
324
-
325
-
326
-
327
-
328
-
329
 |
 |
HSBC HOLDINGS PLC
Financial Review (continued)
142
The above figures were computed in accordance
with the EU Banking Consolidation Directive. The
comparative figures for 31 December 2001 have not
been restated for the impact of FRS19, details of
which are set out in Note 1 on pages 195 to 197.
Tier 1 capital increased by US$3.9 billion.
Retained profits on a cash basis (excluding goodwill
amortisation) contributed US$2.1 billion and shares
issued through options and scrip dividends
contributed US$1.4 billion. Exchange movements on
reserves also contributed US$3.7 billion to this
increase. The acquisition of Grupo Financiero Bital
and currency translation differences contributed
US$1.9 billion and US$1.7 billion to the increase in
goodwill and intangible assets deducted from tier 1
capital.
The increase of US$3.2 billion in tier 2 capital
mainly reflects the proceeds of capital issues, net of
redemption and regulatory amortisation.
Total risk-weighted assets increased by US$39
billion. The acquisition of GFBital contributed US$8
billion to this increase. The remaining increase was
largely due to currency translation differences
together with the effect of growth in the loan book.
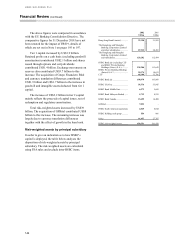
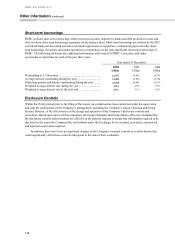
Risk-weighted assets by principal subsidiary
In order to give an indication as to how HSBC’s
capital is deployed, the table below analyses the
disposition of risk-weighted assets by principal
subsidiary. The risk-weighted assets are calculated
using FSA rules and exclude intra-HSBC items.
2002
US$m
2001
US$
m
Hang Seng Bank Limited.............. 32,350 31,992
The Hongkong and Shanghai
Banking Corporation Limited
and other subsidiaries............... 87,932 80,492
The Hongkong and Shanghai
Banking Corporation Limited
and subsidiaries........................ 120,282 112,484
HSBC Bank plc (excluding CCF
and HSBC Private Banking
Holdings (Suisse) S.A.)............ 138,206 113,643
HSBC Private Banking Holdings
(Suisse) S.A.* .......................... 20,374 14,611
CCF 40,399 35,706
HSBC Bank plc ............................ 198,979 163,960
HSBC USA Inc ............................ 54,576 53,945
HSBC Bank Middle East.............. 6,573 5,699
HSBC Bank Malaysia Berhad ...... 4,713 4,215
HSBC Bank Canada ..................... 15,499 14,400
GFBital......................................... 7,853
–
HSBC South American operations 4,865 8,044
HSBC Holdings sub-group ........... 554 966
Other 16,657 27,765
HSBC risk-weighted assets........... 430,551 391,478