HSBC 2002 Annual Report Download - page 196
Download and view the complete annual report
Please find page 196 of the 2002 HSBC annual report below. You can navigate through the pages in the report by either clicking on the pages listed below, or by using the keyword search tool below to find specific information within the annual report.-
 1
1 -
2
-
3
-
4
-
5
-
6
-
7
-
8
-
9
-
10
-
11
-
12
-
13
-
14
-
15
-
16
-
17
-
18
-
19
-
20
-
21
-
22
-
23
-
24
-
25
-
26
-
27
-
28
-
29
-
30
-
31
-
32
-
33
-
34
-
35
-
36
-
37
-
38
-
39
-
40
-
41
-
42
-
43
-
44
-
45
-
46
-
47
-
48
-
49
-
50
-
51
-
52
-
53
-
54
-
55
-
56
-
57
-
58
-
59
-
60
-
61
-
62
-
63
-
64
-
65
-
66
-
67
-
68
-
69
-
70
-
71
-
72
-
73
-
74
-
75
-
76
-
77
-
78
-
79
-
80
-
81
-
82
-
83
-
84
-
85
-
86
-
87
-
88
-
89
-
90
-
91
-
92
-
93
-
94
-
95
-
96
-
97
-
98
-
99
-
100
-
101
-
102
-
103
-
104
-
105
-
106
-
107
-
108
-
109
-
110
-
111
-
112
-
113
-
114
-
115
-
116
-
117
-
118
-
119
-
120
-
121
-
122
-
123
-
124
-
125
-
126
-
127
-
128
-
129
-
130
-
131
-
132
-
133
-
134
-
135
-
136
-
137
-
138
-
139
-
140
-
141
-
142
-
143
-
144
-
145
-
146
-
147
-
148
-
149
-
150
-
151
-
152
-
153
-
154
-
155
-
156
-
157
-
158
-
159
-
160
-
161
-
162
-
163
-
164
-
165
-
166
-
167
-
168
-
169
-
170
-
171
-
172
-
173
-
174
-
175
-
176
-
177
-
178
-
179
-
180
-
181
-
182
-
183
-
184
-
185
-
 186
186 -
 187
187 -
 188
188 -
 189
189 -
 190
190 -
 191
191 -
 192
192 -
 193
193 -
 194
194 -
 195
195 -
 196
196 -
 197
197 -
 198
198 -
 199
199 -
 200
200 -
 201
201 -
 202
202 -
 203
203 -
 204
204 -
 205
205 -
 206
206 -
207
-
208
-
209
-
210
-
211
-
212
-
213
-
214
-
215
-
216
-
217
-
218
-
219
-
220
-
221
-
222
-
223
-
224
-
225
-
226
-
227
-
228
-
229
-
230
-
231
-
232
-
233
-
234
-
235
-
236
-
237
-
238
-
239
-
240
-
241
-
242
-
243
-
244
-
245
-
246
-
247
-
248
-
249
-
250
-
251
-
252
-
253
-
254
-
255
-
256
-
257
-
258
-
259
-
260
-
261
-
262
-
263
-
264
-
265
-
266
-
267
-
268
-
269
-
270
-
271
-
272
-
273
-
274
-
275
-
276
-
277
-
278
-
279
-
280
-
281
-
282
-
283
-
284
-
285
-
286
-
287
-
288
-
289
-
290
-
291
-
292
-
293
-
294
-
295
-
296
-
297
-
298
-
299
-
300
-
301
-
302
-
303
-
304
-
305
-
306
-
307
-
308
-
309
-
310
-
311
-
312
-
313
-
314
-
315
-
316
-
317
-
318
-
319
-
320
-
321
-
322
-
323
-
324
-
325
-
326
-
327
-
328
-
329
 |
 |

HSBC HOLDINGS PLC
Financial Statements (continued)
194
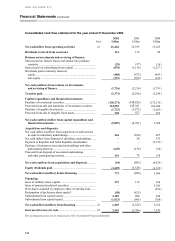
Consolidated cash flow statement for the year ended 31 December 2002
2002 2001 2000
N
ote US$m US$
m
US$
m
Net cash inflow from operating activities 41 16,426 12,915 15,223
Dividends received from associates 114 113 88
Returns on investments and servicing of finance:
Interest paid on finance leases and similar hire purchase
contracts .............................................................................. (29 ) (27)(26)
Interest paid on subordinated loan capital............................... (870) (1,116) (1,217)
Dividends paid to minority interests:
– equit
y
................................................................................... (480) (472) (443)
– non-equit
y
........................................................................... (357) (599) (105)
Net cash (outflow) from returns on investments
and servicing of finance .................................................... (1,736) (2,214) (1,791)
Taxation paid ........................................................................ (1,371) (2,106) (2,290)
Capital expenditure and financial investments:
Purchase of investment securities ........................................... (130,171) (148,826) (175,176)
Proceeds from sale and maturities of investment securities 122,559 145,361 180,044
Purchase of tangible fixed assets ............................................ (1,723) (1,873) (1,663)
Proceeds from sale of tangible fixed assets............................. 328 557 383
Net cash (outflow)/inflow from capital expenditure and
financial investments......................................................... (9,007) (4,781)3,588
Acquisitions and disposals:
Net cash inflow/(outflow) from acquisition of and increase
in stake in subsidiary undertakings...................................... 264 (834) 687
N
et cash inflow from disposal of subsidiary undertakings ..... –26 333
Payment to Republic and Safra Republic shareholders –
–
(9,733)
Purchase of interest in associated undertakings and other
p
articipating interests .......................................................... (649) (154)(54)
Proceeds from disposal of associated undertakings
and other participating interests........................................... 341 79 138
Net cash (outflow) from acquisitions and disposals ........... (44) (883) (8,629)
Equity dividends paid........................................................... (3,609) (3,528) (2,193)
Net cash inflow/(outflow) before financing ......................... 773 (484)3,996
Financing:
Issue of ordinary share capital ................................................ 337 112 164
Issue of perpetual preferred securities..................................... –
–
3,626
Own shares acquired by employee share ownership trus
t
....... –
–
(556)
Redemption of preference share capital (50) (825)
–
Subordinated loan capital issued............................................. 4,105 456 948
Subordinated loan capital repaid............................................. (1,923) (965) (708)
Net cash inflow/(outflow) from financing ........................... 42 2,469 (1,222)3,474
Increase/(decrease) in cash................................................... 43 3,242 (1,706)7,470
The accompanying notes are an integral part of the Consolidated Financial Statements