HSBC 2002 Annual Report Download - page 207
Download and view the complete annual report
Please find page 207 of the 2002 HSBC annual report below. You can navigate through the pages in the report by either clicking on the pages listed below, or by using the keyword search tool below to find specific information within the annual report.-
 1
1 -
2
-
3
-
4
-
5
-
6
-
7
-
8
-
9
-
10
-
11
-
12
-
13
-
14
-
15
-
16
-
17
-
18
-
19
-
20
-
21
-
22
-
23
-
24
-
25
-
26
-
27
-
28
-
29
-
30
-
31
-
32
-
33
-
34
-
35
-
36
-
37
-
38
-
39
-
40
-
41
-
42
-
43
-
44
-
45
-
46
-
47
-
48
-
49
-
50
-
51
-
52
-
53
-
54
-
55
-
56
-
57
-
58
-
59
-
60
-
61
-
62
-
63
-
64
-
65
-
66
-
67
-
68
-
69
-
70
-
71
-
72
-
73
-
74
-
75
-
76
-
77
-
78
-
79
-
80
-
81
-
82
-
83
-
84
-
85
-
86
-
87
-
88
-
89
-
90
-
91
-
92
-
93
-
94
-
95
-
96
-
97
-
98
-
99
-
100
-
101
-
102
-
103
-
104
-
105
-
106
-
107
-
108
-
109
-
110
-
111
-
112
-
113
-
114
-
115
-
116
-
117
-
118
-
119
-
120
-
121
-
122
-
123
-
124
-
125
-
126
-
127
-
128
-
129
-
130
-
131
-
132
-
133
-
134
-
135
-
136
-
137
-
138
-
139
-
140
-
141
-
142
-
143
-
144
-
145
-
146
-
147
-
148
-
149
-
150
-
151
-
152
-
153
-
154
-
155
-
156
-
157
-
158
-
159
-
160
-
161
-
162
-
163
-
164
-
165
-
166
-
167
-
168
-
169
-
170
-
171
-
172
-
173
-
174
-
175
-
176
-
177
-
178
-
179
-
180
-
181
-
182
-
183
-
184
-
185
-
186
-
187
-
188
-
189
-
190
-
191
-
192
-
193
-
194
-
195
-
196
-
 197
197 -
 198
198 -
 199
199 -
 200
200 -
 201
201 -
 202
202 -
 203
203 -
 204
204 -
 205
205 -
 206
206 -
 207
207 -
 208
208 -
 209
209 -
 210
210 -
 211
211 -
 212
212 -
 213
213 -
 214
214 -
 215
215 -
 216
216 -
 217
217 -
218
-
219
-
220
-
221
-
222
-
223
-
224
-
225
-
226
-
227
-
228
-
229
-
230
-
231
-
232
-
233
-
234
-
235
-
236
-
237
-
238
-
239
-
240
-
241
-
242
-
243
-
244
-
245
-
246
-
247
-
248
-
249
-
250
-
251
-
252
-
253
-
254
-
255
-
256
-
257
-
258
-
259
-
260
-
261
-
262
-
263
-
264
-
265
-
266
-
267
-
268
-
269
-
270
-
271
-
272
-
273
-
274
-
275
-
276
-
277
-
278
-
279
-
280
-
281
-
282
-
283
-
284
-
285
-
286
-
287
-
288
-
289
-
290
-
291
-
292
-
293
-
294
-
295
-
296
-
297
-
298
-
299
-
300
-
301
-
302
-
303
-
304
-
305
-
306
-
307
-
308
-
309
-
310
-
311
-
312
-
313
-
314
-
315
-
316
-
317
-
318
-
319
-
320
-
321
-
322
-
323
-
324
-
325
-
326
-
327
-
328
-
329
 |
 |

205
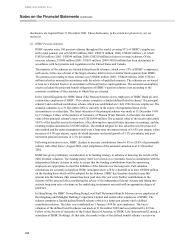
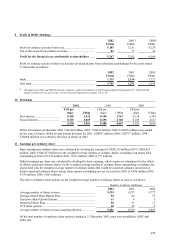
US$794 million. On an ongoing basis, the actuarial value of the scheme’ s assets represented 111% of the
benefits accrued to members, after allowing for expected future increases in salaries, and the resulting
surplus amounted to US$81 million. On a wind-up basis, the actuarial value of the scheme’ s assets
represents 114% of the members’ vested benefits, based on current salaries, and the resulting surplus
amounted to US$100 million. The actuarial method used was the projected unit credit method and the main
assumptions used in this valuation were a long-term investment return of 5.5% per annum and salary
increases of 4.5% per annum.
In the United States, the HSBC Bank USA Pension Plan (the ‘principal scheme’ ) covers employees of
HSBC Bank USA and certain other employees of HSBC. The latest valuation of the principal scheme was
made at 1 January 2002 by R G Gendron and K G Leister, Fellows of the Society of Actuaries, of Hewitt
Associates LLC. At that date, the market value of the principal scheme’ s assets was US$772 million. The
actuarial value of the assets represented 92% of the benefits accrued to members, after allowing for
expected future increases in earnings, and the resulting deficit amounted to US$67 million. This deficit was
eliminated by means of contributions made to the scheme in 2002. The method employed for this valuation
was the projected unit credit method and the main assumptions used were a discount rate of 7.25% per
annum and average salary increases of 4.0% per annum.
The HSBC Bank (UK) Pension Scheme, The HSBC Group Hong Kong Local Staff Retirement Benefits
Scheme and the HSBC Bank USA Pension Plan cover 37% (2001: 42%, 2000: 45%) of HSBC’ s
employees.
The pension cost for defined contribution schemes, which cover 38% (2001: 41%; 2000: 24%) of HSBC’ s
employees, was US$152 million (2001: US$144 million; 2000: US$81 million).
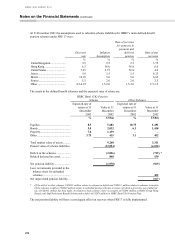
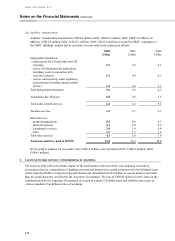
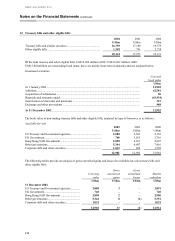
(ii) FRS 17 Retirement Benefits
At 31 December 2002 the assumptions used to calculate scheme liabilities for HSBC’ s main defined benefit
pension schemes under FRS 17 are:
D
iscoun
t
rate Inflation
Assumption
Rate of increase
for pensions in
p
ayment an
d
deferre
d
pension Rate of pay
increase
%%%%
United Kingdom ............... 5.6 2.25 2.25 2.75
Hong Kong ....................... 5.5 N/A N/A 4.5
United States..................... 6.75 2.5 N/A 3.75
Jersey ................................ 5.6 2.25 2.25 4.0
Mexico .............................. 10.78 5.0 5.0 7.62
Brazil ................................ 10.25 5.0 5.0 6.05
France ............................... 5.5 2.0 2.0 3.5
Other ................................. 3.75-6.75 1.5-2.0 0-1.5 2.5-3.0