HSBC 2002 Annual Report Download - page 134
Download and view the complete annual report
Please find page 134 of the 2002 HSBC annual report below. You can navigate through the pages in the report by either clicking on the pages listed below, or by using the keyword search tool below to find specific information within the annual report.-
 1
1 -
2
-
3
-
4
-
5
-
6
-
7
-
8
-
9
-
10
-
11
-
12
-
13
-
14
-
15
-
16
-
17
-
18
-
19
-
20
-
21
-
22
-
23
-
24
-
25
-
26
-
27
-
28
-
29
-
30
-
31
-
32
-
33
-
34
-
35
-
36
-
37
-
38
-
39
-
40
-
41
-
42
-
43
-
44
-
45
-
46
-
47
-
48
-
49
-
50
-
51
-
52
-
53
-
54
-
55
-
56
-
57
-
58
-
59
-
60
-
61
-
62
-
63
-
64
-
65
-
66
-
67
-
68
-
69
-
70
-
71
-
72
-
73
-
74
-
75
-
76
-
77
-
78
-
79
-
80
-
81
-
82
-
83
-
84
-
85
-
86
-
87
-
88
-
89
-
90
-
91
-
92
-
93
-
94
-
95
-
96
-
97
-
98
-
99
-
100
-
101
-
102
-
103
-
104
-
105
-
106
-
107
-
108
-
109
-
110
-
111
-
112
-
113
-
114
-
115
-
116
-
117
-
118
-
119
-
120
-
121
-
122
-
123
-
 124
124 -
 125
125 -
 126
126 -
 127
127 -
 128
128 -
 129
129 -
 130
130 -
 131
131 -
 132
132 -
 133
133 -
 134
134 -
 135
135 -
 136
136 -
 137
137 -
 138
138 -
 139
139 -
 140
140 -
 141
141 -
 142
142 -
 143
143 -
 144
144 -
145
-
146
-
147
-
148
-
149
-
150
-
151
-
152
-
153
-
154
-
155
-
156
-
157
-
158
-
159
-
160
-
161
-
162
-
163
-
164
-
165
-
166
-
167
-
168
-
169
-
170
-
171
-
172
-
173
-
174
-
175
-
176
-
177
-
178
-
179
-
180
-
181
-
182
-
183
-
184
-
185
-
186
-
187
-
188
-
189
-
190
-
191
-
192
-
193
-
194
-
195
-
196
-
197
-
198
-
199
-
200
-
201
-
202
-
203
-
204
-
205
-
206
-
207
-
208
-
209
-
210
-
211
-
212
-
213
-
214
-
215
-
216
-
217
-
218
-
219
-
220
-
221
-
222
-
223
-
224
-
225
-
226
-
227
-
228
-
229
-
230
-
231
-
232
-
233
-
234
-
235
-
236
-
237
-
238
-
239
-
240
-
241
-
242
-
243
-
244
-
245
-
246
-
247
-
248
-
249
-
250
-
251
-
252
-
253
-
254
-
255
-
256
-
257
-
258
-
259
-
260
-
261
-
262
-
263
-
264
-
265
-
266
-
267
-
268
-
269
-
270
-
271
-
272
-
273
-
274
-
275
-
276
-
277
-
278
-
279
-
280
-
281
-
282
-
283
-
284
-
285
-
286
-
287
-
288
-
289
-
290
-
291
-
292
-
293
-
294
-
295
-
296
-
297
-
298
-
299
-
300
-
301
-
302
-
303
-
304
-
305
-
306
-
307
-
308
-
309
-
310
-
311
-
312
-
313
-
314
-
315
-
316
-
317
-
318
-
319
-
320
-
321
-
322
-
323
-
324
-
325
-
326
-
327
-
328
-
329
 |
 |

HSBC HOLDINGS PLC
Financial Review (continued)
132
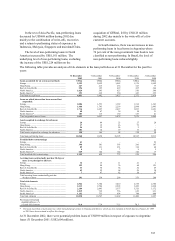
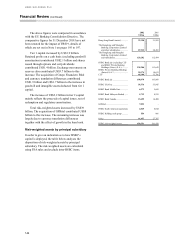
Interest forgone on non-performing lendings
Interest income that would have been recognised
under the original terms of the non-accrual,
suspended interest and restructured loans amounted
to approximately US$617 million in 2002 compared
with US$640 million in 2001, US$955 million in
2000, US$946 million in 1999 and US$811 million
in 1998. Interest income of approximately US$258
million in 2002 from such loans was recorded in
2002, compared with US$261 million in 2001,
US$324 million in 2000, US$328 million in 1999
and US$192 million in 1998.
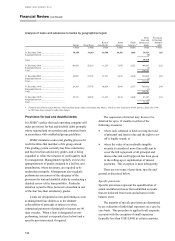
Non-performing customer loans* and related
specific provisions outstanding by geographical
segment
Non-
performing
loans
Specific
Provisions
Non-
p
erforming
loans
Specific
p
rovisions
2002 2002 2001 2001
US$m US$m US$
m
US$
m
Europe.................. 4,495 2,774 3,682 2,204
Hong Kong........... 1,724 688 2,028 856
Rest of Asia-
Pacific ............. 2,055 1,321 2,723 1,786
North America ..... 1,773 1,482 672 289
South America# ... 476 341 544 365
10,523 6,606 9,649 5,500
* net of suspended interest
# Formerly described as Latin America, which included Group
Entities in Panama and Mexico, which are now included in North
America, figures for 2001 have been restated to reflect this change.
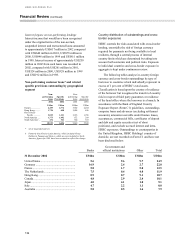
Country distribution of outstandings and cross-
border exposures
HSBC controls the risks associated with cross-border
lending, essentially the risk of foreign currency
required for payments not being available to local
residents, through a central process of internal
country limits which are determined by taking into
account both economic and political risks. Exposure
to individual countries and cross-border exposure in
aggregate is kept under continuous review.
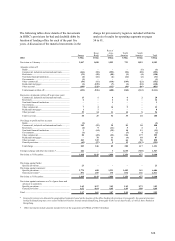
The following tables analyse in-country foreign
currency and cross-border outstandings by type of
borrower to countries which individually represent in
excess of 1 per cent of HSBC’s total assets.
Classification is based upon the country of residence
of the borrower but recognises the transfer of country
risk in respect of third party guarantees or residence
of the head office where the borrower is a branch. In
accordance with the Bank of England Country
Exposure Report (Form C1) guidelines, outstandings
comprise loans and advances (excluding settlement
accounts), amounts receivable under finance leases,
acceptances, commercial bills, certificates of deposit
and debt and equity securities (net of short
positions), and exclude accrued interest and intra-
HSBC exposures. Outstandings to counterparties in
the United Kingdom, HSBC Holdings’ country of
domicile, are not recorded on Form C1 and have not
been disclosed below.
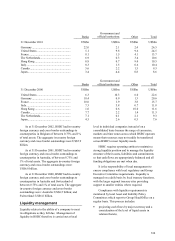
Banks
Government and
official institutions Other Total
31 December 2002 US$bn US$bn US$bn US$bn
United States................................................ 5.6 9.6 9.7 24.9
Germany ...................................................... 16.9 2.4 2.7 22.0
France .......................................................... 5.8 1.7 5.0 12.5
The Netherlands........................................... 7.5 0.4 4.0 11.9
Hong Kong .................................................. 0.9 0.7 9.1 10.7
Canada ......................................................... 4.8 2.9 2.4 10.1
Japan............................................................ 4.0 4.1 1.0 9.1
Italy.............................................................. 4.7 2.2 1.1 8.0
Australia ...................................................... 5.8 0.5 1.6 7.9