HSBC 2002 Annual Report Download - page 264
Download and view the complete annual report
Please find page 264 of the 2002 HSBC annual report below. You can navigate through the pages in the report by either clicking on the pages listed below, or by using the keyword search tool below to find specific information within the annual report.-
 1
1 -
2
-
3
-
4
-
5
-
6
-
7
-
8
-
9
-
10
-
11
-
12
-
13
-
14
-
15
-
16
-
17
-
18
-
19
-
20
-
21
-
22
-
23
-
24
-
25
-
26
-
27
-
28
-
29
-
30
-
31
-
32
-
33
-
34
-
35
-
36
-
37
-
38
-
39
-
40
-
41
-
42
-
43
-
44
-
45
-
46
-
47
-
48
-
49
-
50
-
51
-
52
-
53
-
54
-
55
-
56
-
57
-
58
-
59
-
60
-
61
-
62
-
63
-
64
-
65
-
66
-
67
-
68
-
69
-
70
-
71
-
72
-
73
-
74
-
75
-
76
-
77
-
78
-
79
-
80
-
81
-
82
-
83
-
84
-
85
-
86
-
87
-
88
-
89
-
90
-
91
-
92
-
93
-
94
-
95
-
96
-
97
-
98
-
99
-
100
-
101
-
102
-
103
-
104
-
105
-
106
-
107
-
108
-
109
-
110
-
111
-
112
-
113
-
114
-
115
-
116
-
117
-
118
-
119
-
120
-
121
-
122
-
123
-
124
-
125
-
126
-
127
-
128
-
129
-
130
-
131
-
132
-
133
-
134
-
135
-
136
-
137
-
138
-
139
-
140
-
141
-
142
-
143
-
144
-
145
-
146
-
147
-
148
-
149
-
150
-
151
-
152
-
153
-
154
-
155
-
156
-
157
-
158
-
159
-
160
-
161
-
162
-
163
-
164
-
165
-
166
-
167
-
168
-
169
-
170
-
171
-
172
-
173
-
174
-
175
-
176
-
177
-
178
-
179
-
180
-
181
-
182
-
183
-
184
-
185
-
186
-
187
-
188
-
189
-
190
-
191
-
192
-
193
-
194
-
195
-
196
-
197
-
198
-
199
-
200
-
201
-
202
-
203
-
204
-
205
-
206
-
207
-
208
-
209
-
210
-
211
-
212
-
213
-
214
-
215
-
216
-
217
-
218
-
219
-
220
-
221
-
222
-
223
-
224
-
225
-
226
-
227
-
228
-
229
-
230
-
231
-
232
-
233
-
234
-
235
-
236
-
237
-
238
-
239
-
240
-
241
-
242
-
243
-
244
-
245
-
246
-
247
-
248
-
249
-
250
-
251
-
252
-
253
-
 254
254 -
 255
255 -
 256
256 -
 257
257 -
 258
258 -
 259
259 -
 260
260 -
 261
261 -
 262
262 -
 263
263 -
 264
264 -
 265
265 -
 266
266 -
 267
267 -
 268
268 -
 269
269 -
 270
270 -
 271
271 -
 272
272 -
 273
273 -
 274
274 -
275
-
276
-
277
-
278
-
279
-
280
-
281
-
282
-
283
-
284
-
285
-
286
-
287
-
288
-
289
-
290
-
291
-
292
-
293
-
294
-
295
-
296
-
297
-
298
-
299
-
300
-
301
-
302
-
303
-
304
-
305
-
306
-
307
-
308
-
309
-
310
-
311
-
312
-
313
-
314
-
315
-
316
-
317
-
318
-
319
-
320
-
321
-
322
-
323
-
324
-
325
-
326
-
327
-
328
-
329
 |
 |

HSBC HOLDINGS PLC
Notes on the Financial Statements (continued)
262
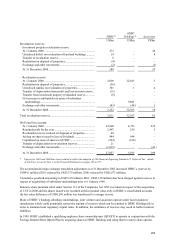
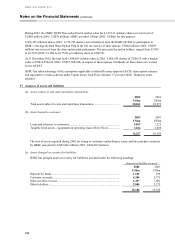
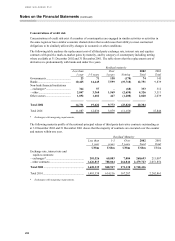
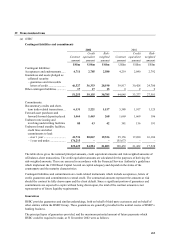
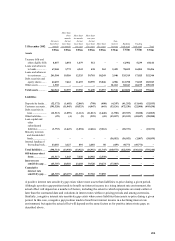
Concentrations of credit risk
Concentrations of credit risk exist if a number of counterparties are engaged in similar activities or activities in
the same region or have similar economic characteristics that would cause their ability to meet contractual
obligations to be similarly affected by changes in economic or other conditions.
The following table analyses the replacement cost of all third party exchange rate, interest rate and equities
contracts with positive mark-to-market gains by maturity, and by category of counterparty including netting
where available at 31 December 2002 and 31 December 2001. The table shows that the replacement cost of
derivatives is predominantly with banks and under five years.
Residual maturity
Less than
1 year 1-5 years Over
5 years
N
ettin
g
2002
Tota
l
2001
Tota
l
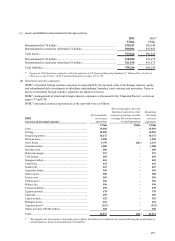
Governments.................................. 23 71 158 (178) 74 145
Banks ............................................. 10,425 14,445 7,599 (19,718) 12,751 9,839
Non-bank financial institutions
– exchanges*.................................. 344 57 – (68) 333 312
– other............................................ 2,047 3,368 1,569 (2,658) 4,326 3,511
Other sectors .................................. 1,892 1,681 447 (1,200) 2,820 2,039
Total 2002 14,731 19,622 9,773 (23,822) 20,304
Total 2001 11,087 12,036 3,879 (11,156) 15,846
*Exchanges with margining requirements.
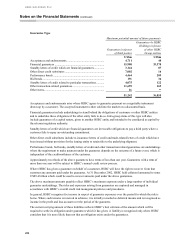
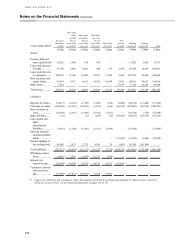
The following maturity profile of the notional principal values of third party derivative contracts outstanding as
at 31 December 2002 and 31 December 2001 shows that the majority of contracts are executed over the counter
and mature within one year.
Residual Maturity
Less than
1 year 1-5
years Over
5 years 2002
Tota
l
2001
Tota
l
US$m US$m US$m US$m US$m
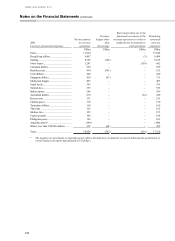
Exchange rate, interest rate and
equities contracts:
– exchanges*.................................................... 201,526 60,083 7,084 268,693 211,007
– other contracts............................................... 1,426,813 788,864 264,046 2,479,723 2,051,854
Total 2002 ....................................................... 1,628,339 848,947 271,130 2,748,416
Total 2001........................................................ 1,481,538 614,116 167,207 2,262,861
*Exchanges with margining requirements.